What is business intelligence? A True explanation for you
Business intelligence turns raw data into useful information that helps you make better decisions. Many companies collect a lot of data every day, but most of them have a hard time getting useful information from it. This complete guide covers everything you need to know about business intelligence, from the basics to implementation plans that can change the way your company makes decisions.
It’s not enough to just know what business intelligence is; you also need to know how data-driven insights can give you an edge over your competitors. This guide will give you the information you need to use BI effectively, whether you are a business owner, an analyst, or a decision-maker.
Businesses today make data at a rate that has never been seen before. There is a lot of information in the interactions with customers, sales transactions, operational metrics, and market trends. Business intelligence is like a compass that helps you find your way through this sea of data to find chances, spot risks, and improve performance.
What is Business Intelligence?
Business intelligence includes tools, apps, and methods for gathering, combining, analyzing, and displaying business data. BI changes raw data into useful information that helps with both strategic and operational decision-making.
What do you mean by business intelligence and analytics? Business intelligence is often used to mean the same thing as analytics, but it is more about descriptive analytics, which is figuring out what happened and why. Analytics goes beyond just looking at data and making predictions. It also tells you what to do based on what it sees.
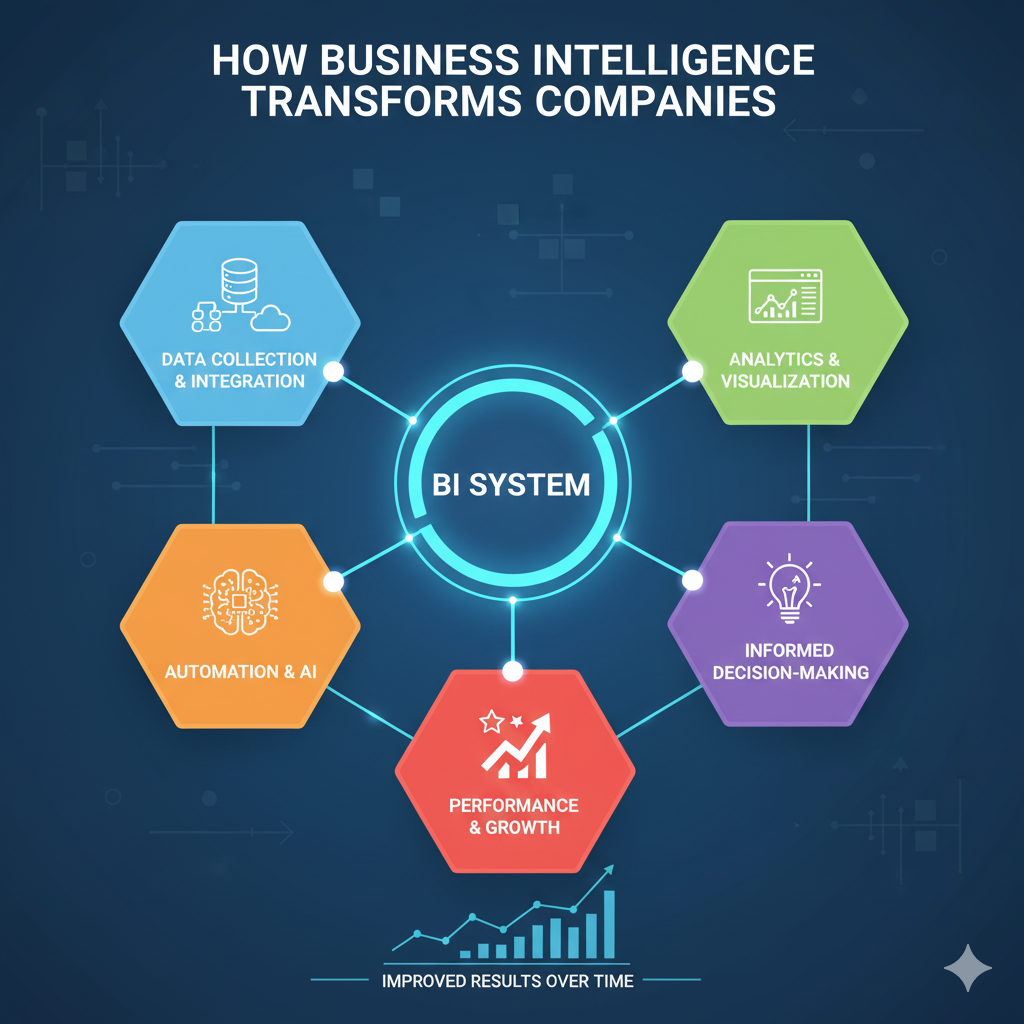
A business intelligence system is made up of several parts that work together without any problems. Data comes from many places and goes into central repositories, where it is processed and analyzed. It then comes out as reports, dashboards, and visualizations that business users can understand and use.
The main goal of business intelligence is still the same in all fields: to help people make decisions based on data that lead to better business results. This could mean identifying cost reduction opportunities, optimizing marketing campaigns, enhancing customer experiences, or streamlining operational processes.
The Growth of Business Intelligence
Business intelligence has changed a lot in the last few decades. Early BI systems needed a lot of IT work, complicated data modeling, and a lot of money spent on infrastructure. Users had to wait weeks or months for reports, which made it harder for businesses to respond quickly.
In the past, BI worked on a “pull” model, where users asked for certain reports and IT departments made them. This method caused delays and often gave information too late to have an effect on important choices.
Self-service features, cloud deployment, and real-time processing are all part of modern business intelligence. Users can now look at data on their own, make their own visualizations, and get insights right away. This change makes analytics available to everyone, giving business users the tools they need to become citizen data scientists.
The use of AI and machine learning together has sped up the evolution of BI even more. These days, systems can find patterns, make suggestions, and even guess what will happen in the future with very little help from people.
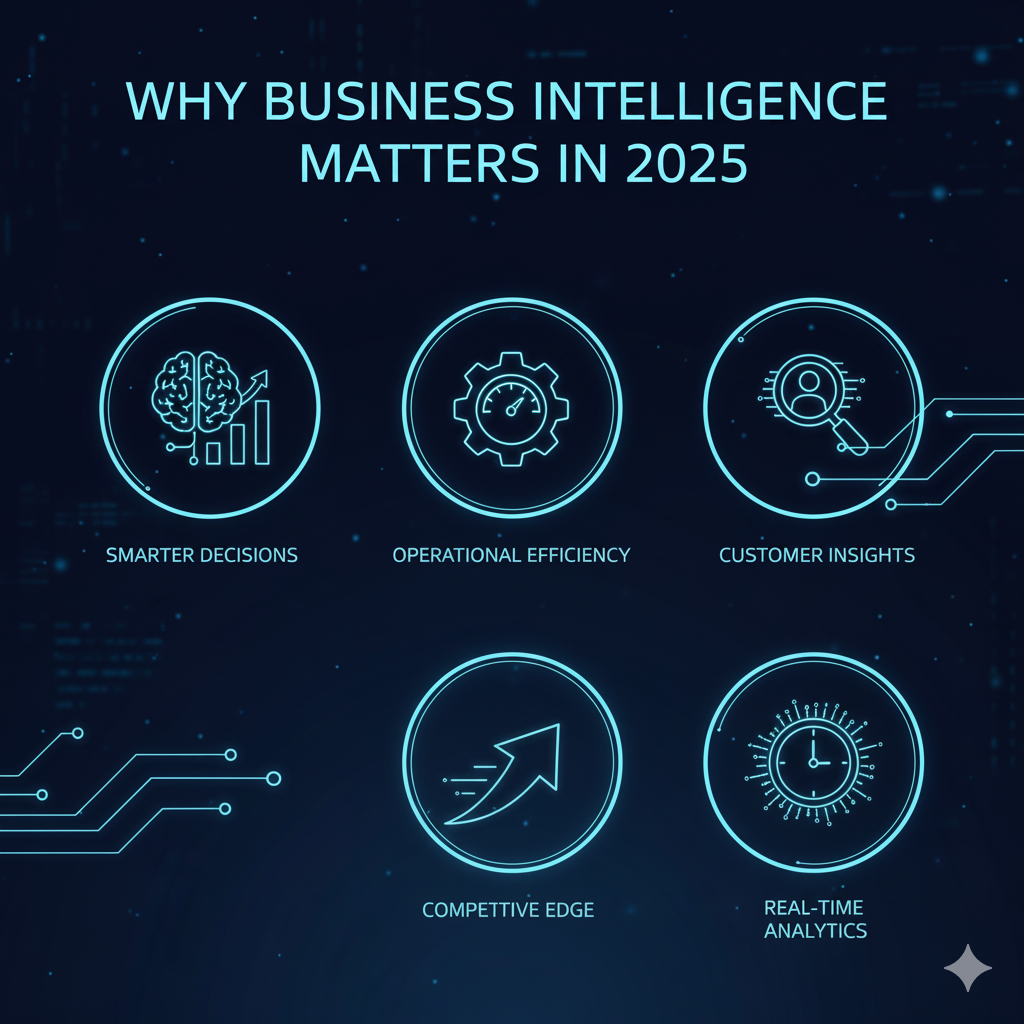
Why Business Intelligence Is Important
Business intelligence is important for more than just making nice charts and reports. Businesses that use good BI strategies always do better than their competitors on a number of metrics.
Companies that use data are 23 times more likely to get new customers, six times more likely to keep them, and 19 times more likely to make money. These numbers show how business intelligence has a direct effect on the bottom line.
BI takes the guesswork out of making decisions. Leaders don’t just rely on gut feelings or incomplete information; they get complete, accurate, and timely data insights. This change from reactive to proactive management gives businesses long-term competitive advantages.
Business intelligence makes risk management more advanced. Companies can spot problems before they get worse, keep an eye on key performance indicators in real time, and take action to fix them quickly.
Key Parts and Steps of BI
Data Warehousing and ETL Processes
Most business intelligence systems are built on data warehousing. A data warehouse serves as a centralized repository that stores historical and current data from multiple sources in a consistent format.
ETL processes take data from source systems and put it into the warehouse. Data is taken from different systems, such as CRMs, ERPs, and databases, during extraction. The transformation phase cleans, checks, and standardizes the data. Finally, loading puts the data that has been processed into the warehouse.
Modern methods often prefer ELT (Extract, Load, Transform) processes, in which raw data is loaded first and then changed as needed. This method is more flexible and makes data available faster at first.
Data quality is still very important during these steps. Bad data quality leads to wrong conclusions and bad choices. Good data governance makes sure that all data sources are consistent, accurate, and reliable.
OLAP, or Online Analytical Processing
OLAP enables multidimensional analysis of business data. OLAP systems are not like traditional databases that are good at processing transactions. Instead, they are made for running complex analytical queries on large datasets.
OLAP cubes group data by things like time, place, product lines, and customer groups. Users can slice and dice data along these dimensions, drilling down for detailed analysis or rolling up for high-level overviews.
This technology supports interactive analysis, which lets users explore data in real time. Business analysts can change the way they look at data, use filters, and pivot tables without needing help from IT.
Data Mining
Data mining finds patterns and connections that aren’t obvious in big datasets. Advanced algorithms identify correlations, trends, and anomalies that might not be obvious through traditional analysis methods.
Classification algorithms guess what will happen in a certain category, like whether a customer will respond to a marketing campaign. Clustering techniques group similar records together, revealing natural segments within your data.
Association rules find connections between different variables, like products that are often bought together. These insights help businesses decide how to optimize their inventory and cross-sell.
Reporting and Dashboards
Reports show business data in a structured way, usually using templates and schedules that have already been set up. Operational reports keep track of what happens every day, while strategic reports look at long-term trends and performance metrics.
Dashboards show key performance indicators in real time in a visual way. Dashboards are different from static reports in that they update all the time and let you explore them interactively. Dashboards that are well-designed show the most important information up front and let users get more information when they need it.
Dashboards that work on mobile devices make sure that decision-makers can get information anytime, anywhere. This accessibility is especially useful for field operations and managing things from a distance.
Advantages of Using Business Intelligence
Better Choices
Business intelligence changes the way people make decisions from an art to a science. Leaders get full, accurate information that helps them understand the whole picture when making important decisions.
Business intelligence analysts look for patterns and trends that help with strategic planning. By looking at past data, you can find strategies that worked and ones that didn’t and should be avoided.
With real-time monitoring, you can quickly respond to changes in the environment. Immediate alerts are sent out when the market changes, operations are disrupted, or customer behavior changes, so management can be proactive.
Increased Operational Efficiency
BI systems identify bottlenecks, redundancies, and inefficiencies throughout business operations. Using data to improve processes can lower costs a lot while also raising quality and speed.
Data-driven insights make resource allocation more accurate. Companies can put their people, equipment, and money where they will get the most return on investment.
Automated reporting takes care of gathering data by hand, which lets employees focus on more important analytical work. This change makes people happier at work and cuts down on costs.
An Edge Over the Competition
Organizations with superior business intelligence capabilities consistently outmaneuver competitors. Faster access to market information lets you respond to chances and threats more quickly.
Through thorough data analysis, we learn more about our customers. Product development, marketing strategies, and service improvements are all based on behavioral patterns, preferences, and lifecycle trends.
Market intelligence gathered through BI systems reveals competitor activities, pricing strategies, and market positioning. This information helps businesses respond better to their competitors.
More information about customers
Business intelligence shows the whole customer journey, from when they first hear about a product to how they act after they buy it. This all-encompassing view makes it possible to give people experiences that are unique to them, which makes them happier and more loyal.
Segmentation analysis shows that there are different groups of customers with different needs, wants, and behaviors. Targeted marketing campaigns get more people to respond and give you a better return on investment (ROI).
Predictive analytics find customers who are likely to leave, which lets you take steps to keep them. Early intervention costs less than getting new customers and keeps important relationships.
Tools and Technologies for Business Intelligence
A look at some of the most popular BI tools
There are a lot of business intelligence tools out there, from simple visualization software to full-fledged enterprise platforms. Leading tools make it easy for everyone in an organization to access data by providing user-friendly interfaces.
What is Power BI? It shows how Microsoft thinks about self-service business intelligence. This cloud-based platform works perfectly with Microsoft Office apps, giving you familiar interfaces and powerful analytics tools.
Tableau was the first to make interactive data visualization possible, which made it easier for people who aren’t tech-savvy to understand complex analysis. Its drag-and-drop interface makes it easy to make dashboards and do advanced statistical analysis.
QlikView and QlikSense provide associative analytics engines that reveal hidden relationships within data. Their in-memory processing makes them work quickly with big datasets.
BI Solutions in the Cloud
Cloud deployment has changed the way businesses can access and scale their business intelligence. Companies can add advanced BI features without spending a lot of money on new infrastructure.
Cloud-based solutions make scalability automatic. The processing power and storage space change automatically to meet changing needs, making sure that performance stays the same during busy times.
Cost models change from capital expenditures to operational expenses, which makes cash flow and budget planning easier. Organizations only pay for the resources they use, which lowers the total cost of ownership.
BI for Yourself
Self-service business intelligence empowers business users to create reports, dashboards, and analyses independently. This makes IT less of a bottleneck and speeds up the delivery of insights.
Users can explore data without having to know a lot about technology thanks to intuitive interfaces. Automated suggestions, drag-and-drop functionality, and natural language queries make complicated analyses easier.
Governance features protect the accuracy of data while giving users freedom. Certified data sources, standardized metrics, and approval workflows make sure that all self-service projects are the same.
BI on the go
Mobile business intelligence gives you insights that go beyond your desktop, helping you make decisions no matter where you are. Field sales teams, remote managers, and executives who travel can all stay connected to important information.
Touch-optimized interfaces change visualizations so that they work on smaller screens without losing any functionality. Gesture-based navigation and voice commands make using a mobile device more enjoyable.
Offline features make sure you can always get to your data, even if you don’t have internet access. Data synchronizes automatically when connections resume, maintaining continuity across environments.
Problems with Implementing Business Intelligence
Problems with Data Quality
Bad data quality hurts whole business intelligence projects. Inconsistent formats, duplicate records, and missing information can all lead to wrong conclusions and bad choices.
Data governance programs set rules, processes, and duties for keeping quality high. Regular audits find problems early, and automated validation rules stop mistakes from spreading.
Master data management makes sure that important business information about things like customers, products, and locations only comes from one place. Centralized management makes sure that systems work the same way.
Integration Challenges
Modern organizations use a lot of different technologies that have different data formats, structures, and ways to get to them. To connect these different systems, you need to plan carefully and use strong technical solutions.
API-based integration methods let systems connect in real time and in a way that is flexible. Modern middleware platforms make it easier to integrate complicated systems while keeping security and performance high.
Change management becomes crucial as new integrations affect existing processes and workflows. Communication, training, and help make sure that things go smoothly.
Not enough skilled workers
As companies improve their analytics capabilities, business intelligence developer skills are still in high demand. The lack of skilled workers affects both business analysis and technical implementation jobs.
Training programs can help people learn new skills and rely less on outside help. Structured learning paths help workers learn everything from the basics to more advanced ways of analyzing data.
When you hire strategically, you look for people who have both technical skills and business sense. The best team members are the ones who can connect what technology can do with what the business needs.
Safety and Compliance
Business intelligence systems handle private data that needs strong security. Data breaches can lead to fines from regulators, damage to your reputation, and a loss of business.
Access controls make sure that users can only see data that is relevant to their jobs and duties. Encryption, multi-factor authentication, and audit trails all add extra layers of security.
Different industries and places have different rules for compliance. Healthcare organizations must comply with HIPAA regulations, whereas financial institutions must adhere to SOX requirements. When you do business in other countries, you have to think about GDPR and other regional rules.
Best Ways to Make BI Work Well
Setting Clear Business Goals
To successfully implement business intelligence, you need to have a clear understanding of your business goals and how to measure success. Vague goals lead to unfocused efforts and disappointing results.
Stakeholder alignment makes sure that everyone knows what is expected of them and how they can help achieve those goals. Regular communication keeps things moving and deals with problems before they happen.
Phased implementation methods add value over time while keeping risk under control. Early successes boost confidence and support for bigger projects.
Making sure data is of high quality and governed
Data governance frameworks set rules, policies, and duties for handling information assets. Clear ownership assignments keep data management from having gaps and overlaps.
Quality metrics keep an eye on how accurate, complete, and consistent data is over time. Automated monitoring finds problems quickly, and trend analysis shows that there are bigger problems that need to be fixed.
Standards for documentation help keep knowledge and make it easier to fix problems. Detailed metadata descriptions help users understand where the data comes from, what it means, and what it can’t do.
Giving training and help
More than technical skills, user adoption is what makes business intelligence work. Comprehensive training programs make sure that users know how to use the tools they have.
Role-based training meets the needs and duties of each user. You need different skills for executive dashboards than you do for operational reporting or advanced analytics.
Ongoing support helps users get past problems and learn new skills. There are many ways to get help, such as through help desk services, user communities, and expert consulting.
Keeping track of and measuring performance
Performance metrics keep track of how well a technical system works and how much value it brings to the business. Technical health can be measured by response times, data freshness, and system availability.
Business metrics look at how many people use the product, how happy they are with it, and how much better decisions are made. Calculating ROI helps decide where to put money and resources.
Regular reviews check on progress toward goals and find ways to make things better. Continuous improvement processes make sure that BI systems change as business needs do.
What Will Happen to Business Intelligence in the Future
Artificial Intelligence and Machine Learning in BI
Combining AI and machine learning changes business intelligence from descriptive to prescriptive analytics. Automated insight discovery finds patterns that people might miss and suggests specific actions.
Natural language processing makes it possible for users to ask questions in plain English, which is called conversational analytics. This ability makes it much easier to get to and analyze data.
Automated machine learning (AutoML) makes advanced analytics available to everyone by automating the process of choosing, training, and deploying models. Business users can leverage sophisticated algorithms without deep technical knowledge.
Analytics in Real Time
Real-time processing lets you respond right away to changes in conditions. Streaming analytics processes data as it comes in, sending out alerts and automatic responses in just a few seconds.
Event-driven architectures can handle complicated real-time situations like fraud detection, managing inventory, and making customer service better. Response times of milliseconds can help you avoid losses or take advantage of chances.
Edge computing moves analytics closer to where the data is, which cuts down on latency and bandwidth needs. IoT devices and sensors gather information from their surroundings and send it to a central location.
Predictive Analysis
Predictive models use past patterns and current trends to guess what will happen in the future. What is business intelligence and data analytics? The evolution of these fields includes advanced forecasting tools that help with strategic planning.
Scenario modeling looks at possible futures based on different ideas. What-if analysis helps leaders figure out what risks and chances come with different strategic choices.
Automated forecasting systems continuously update predictions as new data arrives. Dynamic models change with the times to stay accurate over time.
Analytics Built In
Embedded analytics add business intelligence (BI) features directly to business applications and workflows. Users can get insights in familiar places without having to switch between systems.
White-label solutions let businesses add analytics features to their own apps and brand them as their own. This method keeps the same visual identity while making the user experience better.
API-driven architectures can handle a wide range of embedding situations, from simple charts to complicated analytical apps. Developers can change how things are done to fit their needs.
Case Studies: Business Intelligence Implementations That Worked
Success in the Retail Industry
A big retail chain used full business intelligence to improve inventory management and the customer experience. Integrating real-time sales data made it possible to use flexible pricing and promotion plans.
Customer analytics showed patterns in how people behave that helped create personalized marketing campaigns. Segmentation analysis found high-value customers for targeted retention programs, which raised their lifetime value by 35%.
Optimizing the supply chain cut inventory costs by 20% and made products more available. Predictive analytics accurately predicts demand, which lets businesses make decisions about buying and distributing goods ahead of time.
Changes in healthcare
A regional healthcare system used business intelligence to make patients healthier and run more smoothly. Clinical data integration created comprehensive patient views supporting better treatment decisions.
Analysis of resource optimization found staffing patterns that improved patient care and cut down on overtime costs. Predictive models help plan for future patient volumes by letting you plan ahead for capacity.
Monitoring quality metrics showed areas where improvements could be made, which raised patient satisfaction scores. Automating regulatory reporting cut compliance costs and made it more accurate.
Innovation in Financial Services
A business intelligence company used business intelligence to manage risk and improve customer service. The integration of real-time market data helped traders make quick decisions and improve their portfolios.
Client analytics showed what services clients liked best, which made it possible to give them personalized experiences. Relationship mapping found chances to sell more than one product to a customer, which raised the average value of their accounts.
Regulatory compliance monitoring automated reporting requirements and found possible violations. Early warning systems stopped expensive fines and damage to reputation.
How to Get Started with Business Intelligence
To successfully use business intelligence, you need to plan carefully, get everyone on the same page, and carry out the plan in stages. Organizations should start by looking at what they can do now and figuring out which use cases are most important.
Business intelligence courses and professional development programs can help people in the company learn more while lowering the risks of implementing new ideas. Putting money into your team’s skills will pay off all along the BI journey.
Working together with experienced providers in a strategic way can speed up implementation and help you avoid common mistakes. Organizations can make better decisions and get to value faster with the right help.
Business intelligence is more than just a technology investment; it’s a change toward making decisions based on data that gives you long-term advantages over your competitors. Companies that accept this change will be better prepared for success in a business world that is becoming more complicated.
Getting full business intelligence capabilities takes time, money, and knowledge. But the benefits—better decisions, more efficient operations, and a competitive edge—make the investment worth it for businesses that are ready to get the most out of their data.
Are you ready to use business intelligence to change your company? Business Kiwi’s expert consultants can help you with every step of your BI implementation, from coming up with a strategy to making it work. Our tried-and-true methods and experience in the field help companies get value from their investments faster and avoid common problems that come up during implementation. Call us today to set up a meeting to talk about how business intelligence can help your company succeed.