Best Performing KiwiSaver Funds: What the Official Data Actually Shows

The quick answer
There is no KiwiSaver fund that stays at the top, and any article that hands you a permanent league table of winners is selling you last year’s weather. The Financial Markets Authority (FMA), the regulator that oversees KiwiSaver, puts the research position plainly: past performance is no guide to the future, and top-performing funds in one period quite often do badly in the next. Sorted, the Retirement Commission’s money guidance service, found the same pattern in the data behind its fund finder: previous good performers show some tendency to do worse than average afterwards, partly because winning funds tend to be riskier, with big ups and big downs.
So this guide does something more useful than naming winners that will have changed by the time you read it. It explains how KiwiSaver performance is actually measured, what the official data shows about returns across the whole scheme, and how to check any fund’s current record yourself using the free official tools. If you want the full picture of how funds, fees and providers fit together, our guide to KiwiSaver funds is the companion piece. This one is only about performance: how to read it, how not to be fooled by it, and what actually drives your result over decades.
One boundary up front. Nothing here is financial advice, and nothing here recommends a fund or a provider. Performance figures quoted are drawn from the FMA’s KiwiSaver Annual Report 2025 and from Sorted’s published fund finder methodology, each read in full and attributed where they appear.
Why there is no single best performing fund
Ask which fund performed best and you first have to ask: over what period, in which fund type, and measured how? Change any one of those three and the winner changes.
The period problem. A fund that tops the table over one year can sit mid-pack over five. Short periods reward whatever the market happened to favour most recently. Sorted deliberately uses five-year returns in its fund finder because short-term returns, in its words, can be all over the place, and even five years is not long enough to be sure a trend will continue. Funds younger than five years are left out of that comparison entirely, because they have no five-year record to show.
The category problem. Comparing a growth fund’s return with a conservative fund’s return tells you almost nothing about which manager did a better job. The growth fund holds far more shares and property, so in a rising market it will almost always post the bigger number, and in a falling market the bigger loss. The only comparison with any meaning is between funds of the same type over the same period. Even that needs care. Sorted groups funds into types by the share of growth assets they hold, and the bands are wide: two funds both classed as balanced can hold 35 percent and 62 percent growth assets respectively. In a strong year for shares, the second fund will usually look better simply because it took more risk.
The persistence problem. This is the one that sinks most league tables. If last year’s winner reliably stayed a winner, chasing performance would work. The evidence says it does not. The FMA, summarising the research in its investor myth series, notes that top-performing funds in one period quite often do badly in the next, perhaps because they are higher-risk. Sorted’s fund finder team reached the same conclusion from KiwiSaver data itself: where high returns came from investment strategy rather than low fees, there is some tendency for previous good performers to do worse than average in the future. The exception both sources allow is at the bottom of the table. A fund that has performed poorly against its own type, consistently and over long periods, may be showing you poor management rather than bad luck. Performance data is far better at helping you avoid persistent laggards than at crowning future winners.
How KiwiSaver performance is measured
Every KiwiSaver provider must disclose each fund’s results in a standard format, in a fund update published every quarter and lodged on the Companies Office Disclose register. That standardisation is what makes honest comparison possible. Four features of those numbers matter when you read them.

Returns are annualised. A five-year return of 5 percent means the fund grew at an average of 5 percent a year across the period, not 5 percent in total, and not 5 percent every year. Individual years inside that average can be far higher or far lower, including negative years.
The basis is after fees and tax, or it should be. Sorted’s fund finder and Smart Investor platform show returns after fees and after tax, because that is the money that actually lands in your account. Its methodology page makes the practical point: advertised term deposit rates are typically shown before tax, so comparing a KiwiSaver return with a term deposit rate without adjusting for the different basis flatters the deposit. Some provider material shows returns after charges but before tax, which is a legitimate disclosure but a different number. Before you compare any two figures, check that both sit on the same basis.
Each fund is also shown against a market index. Fund updates include a market index return, a blend of the indices for the markets the fund invests in, calculated with no deduction for charges or tax. It exists so you can see how much of a fund’s result was simply the market moving, and how much the manager added or lost after costs. A fund that beats its index after fees and tax has done something genuinely difficult. A fund that trails it has questions to answer, especially if it charges active management fees.
The warning is part of the format. Providers are required to state that past performance is not indicative of future performance. That sentence is not boilerplate to skip. It is the regulator’s summary of the evidence covered in the previous section, printed on every performance document in the country.
Fund type does most of the work
If manager selection is a weak lever, fund type is a strong one. What a fund holds matters far more to your long-run return than which provider’s badge is on it. Sorted groups every KiwiSaver fund into five types by its share of growth assets, meaning shares, commercial property and some derivatives. Income assets are the rest: bonds and cash.
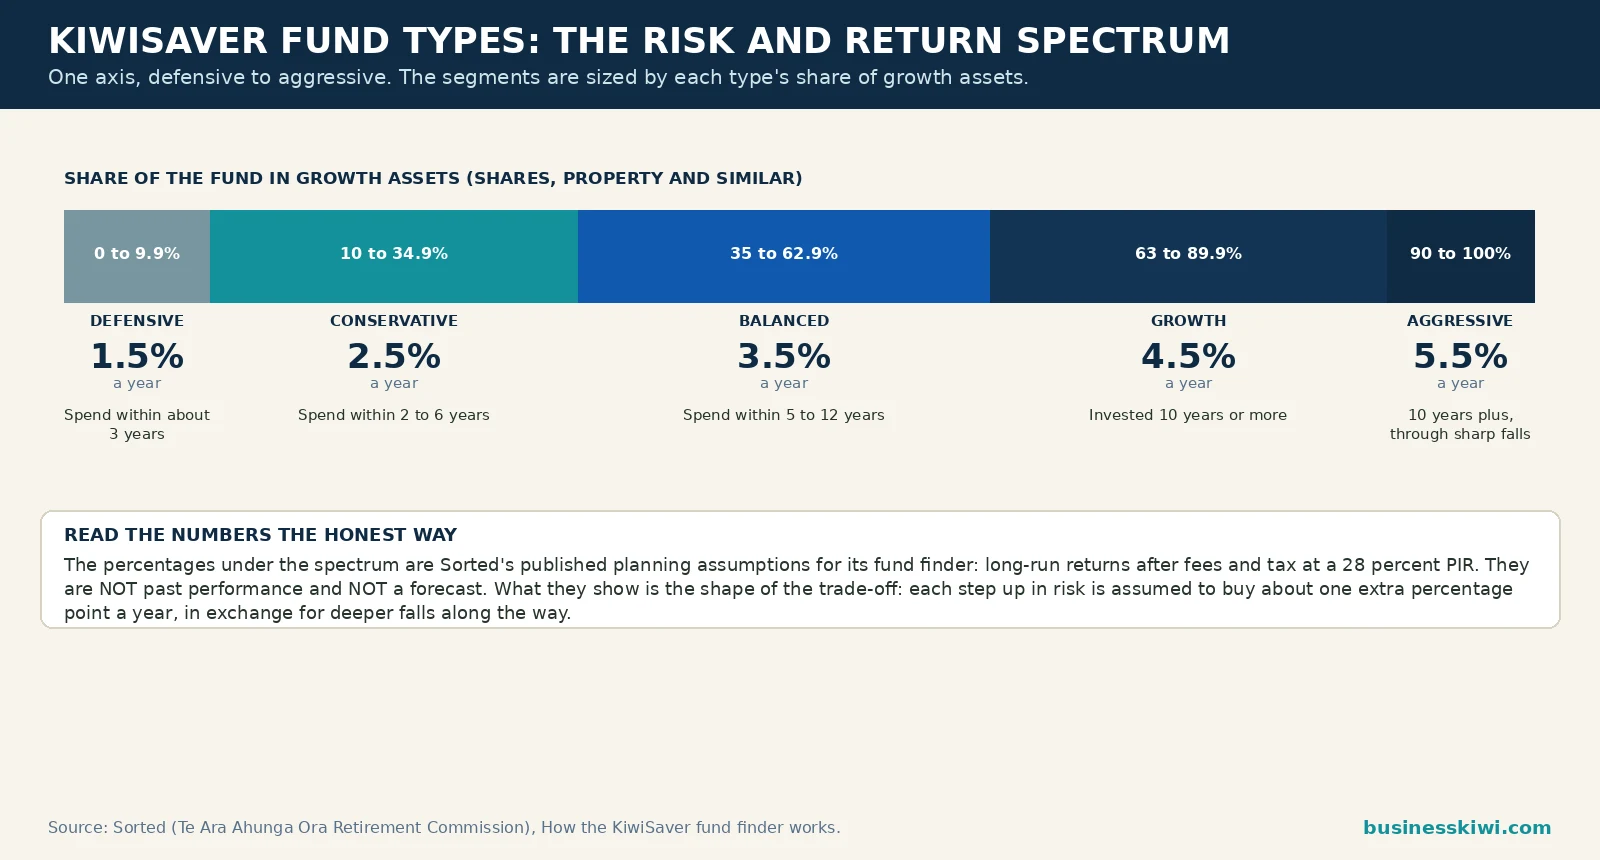
Read the last column carefully. Those are not past returns and they are not forecasts. They are the long-run planning assumptions Sorted’s fund finder uses when it projects balances, published in its methodology so anyone can see the basis. What they show honestly is the shape of the trade-off: each step up the risk ladder is assumed to buy roughly one extra percentage point a year, in exchange for deeper falls along the way. Sorted’s risk profiling follows the same logic. Its questionnaire will not steer anyone who needs their money within three years to anything riskier than a conservative fund, and nothing riskier than balanced for horizons under ten years.
The market has been voting with its feet on this question. The FMA reports that growth funds held 47.5 percent of all KiwiSaver funds under management at 31 March 2025, up from 28.3 percent a decade earlier, while conservative funds shrank from 40.4 percent to 16.2 percent over the same period. Some of that shift is deliberate risk-taking by members with long horizons. Some of it is members chasing the stronger returns growth funds posted in good years, which is exactly the behaviour the next sections warn about.
What the official data shows about KiwiSaver returns
Strip away individual funds and look at the scheme as a whole, and the FMA’s annual reports tell a story about variability that no league table captures.
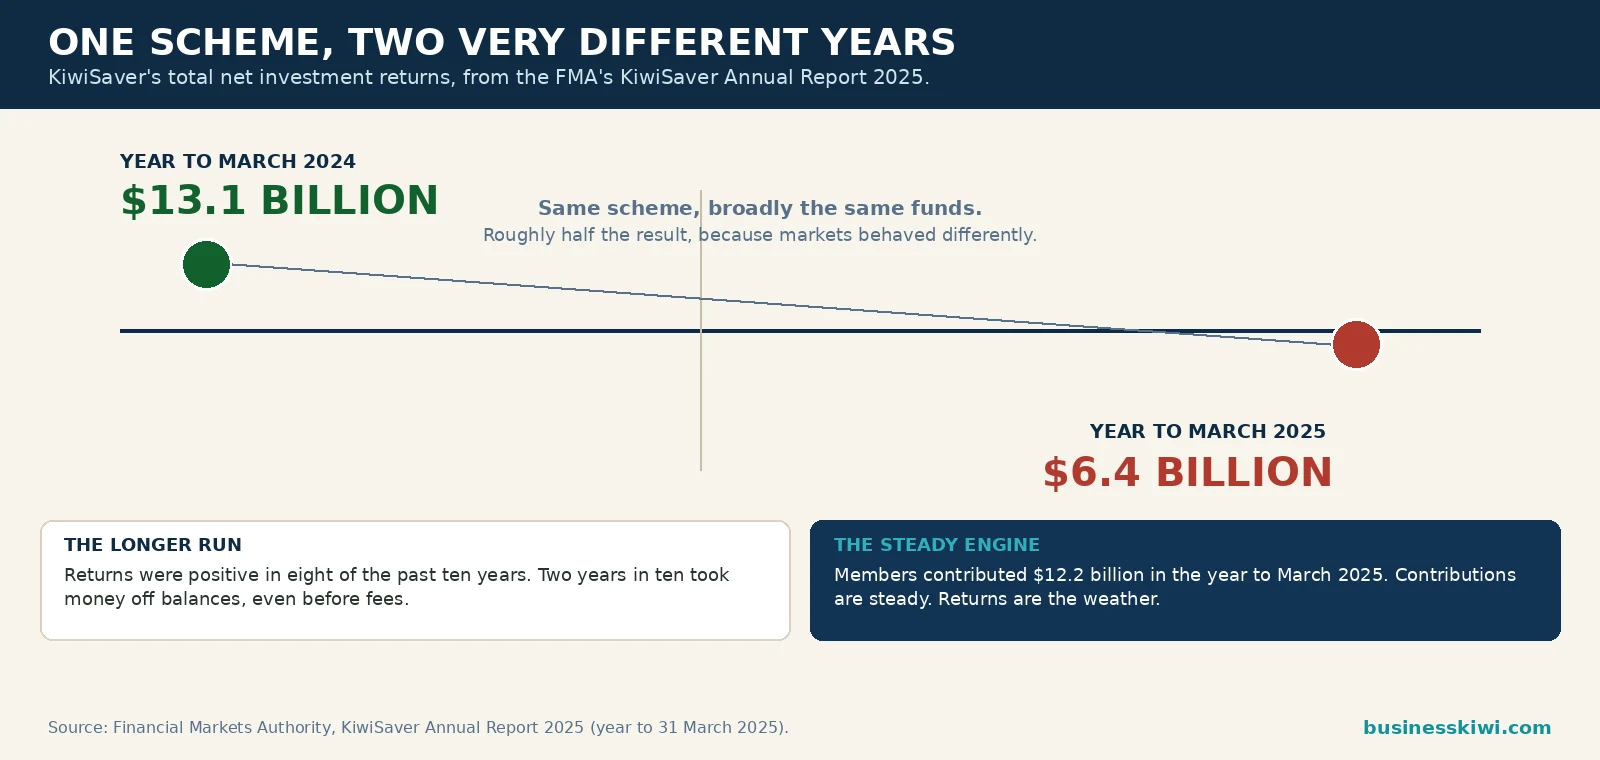
In the year to 31 March 2025, KiwiSaver’s total net investment returns were $6.4 billion. The year before, they were $13.1 billion. Same scheme, broadly the same funds, roughly half the result, purely because markets behaved differently. Across the longer run the FMA notes investment returns have been positive in eight of the past ten years, which means two years in ten took money off balances even before fees. Total funds under management reached $123.1 billion at 31 March 2025, built from $12.2 billion of contributions in that year alongside those returns. Contributions are the steady engine. Returns are the weather.
The most instructive performance comparison in the FMA’s 2025 report involves the funds nobody chose. The six default funds, the balanced funds run by government-appointed providers for members who never made an active choice, had provided average annual returns of 6.5 percent and average three-year returns of 5.2 percent, according to Morningstar data the FMA cites from its March 2025 KiwiSaver report. The average for non-default balanced funds over the same measures was 5.7 percent and 5.0 percent. The default funds, with their regulated settings and no marketing budget, sat ahead of the average actively chosen balanced fund. That does not make default funds the best choice for everyone; fund type fit matters more, and the FMA spends much of its report pushing default providers to engage members who may be in the wrong type entirely. It does make the point that boring, diversified and reasonably priced is a harder combination to beat than performance chasers assume.
The same report records how hard New Zealanders are chasing. Members made more than 380,000 fund switches in the year to March 2025, up 26.5 percent on the year before, moving $9 billion between funds, a rise of over 50 percent. Nearly 270,000 members switched at least once, more than 13 percent of everyone contributing. A further 175,000-plus members transferred between providers entirely, the third annual rise in a row. Some of that movement is healthy maintenance: a fund type corrected, fees reduced, a provider outgrown. But the FMA flags the other kind specifically, warning that incentives and one-off offers should not distract members from well-informed decisions, and that it monitors transfer incentives to make sure they are not working against members’ interests. When switching spikes at the same time as marketing does, the regulator’s suspicion is worth sharing.
Fees and performance: the link that is not there
Fees are the one performance factor you can know in advance, which is why they deserve a section even in a guide about returns. The short version, covered in depth in our KiwiSaver funds pillar, is that fees are deducted inside the fund, totalled as total fund charges, and compounded against you for decades. What matters here is their relationship with performance, because the standard sales pitch for an expensive fund is that you get what you pay for.
The FMA’s own tool says otherwise. Its KiwiSaver Tracker plots funds’ returns against their fees on scatterplots, fund type by fund type. The FMA’s investor guidance, walking through those charts, concludes that high-fee funds do not necessarily have higher returns, that in general there seems to be no correlation between fees and returns, and that low-fee funds perform just as well, on average, as funds charging high fees. Sorted’s fund finder methodology adds the mechanism: if a fund’s good performance is partly the result of low fees, that advantage may continue for as long as the fees stay low, because fees are one of the few persistent features a fund has. Strategy-driven outperformance fades. A fee advantage does not fade until the provider raises the fee.
Scheme-wide, the fee burden has been falling for years. Total KiwiSaver fees were $868.5 million in the year to March 2025, but measured against the money invested they have declined from about 1.10 percent of funds under management in 2012 to around 0.7 percent, where they have stabilised. When you compare two funds of the same type with similar long-run records, the cheaper one starts every future year with a head start. That is the closest thing to a reliable performance prediction the official evidence supports.
How to check any fund’s performance yourself
Current figures change every quarter, and any number printed in an article, including this one, ages. The skill worth having is reading the live data. Three official tools cover everything, and all three are free.
Sorted’s KiwiSaver fund finder and Smart Investor. These show every fund’s average annual return over the past five years, after fees and after tax, drawn directly from the Disclose register data providers must lodge by law, and updated as new quarterly data arrives. Use them the way Sorted built them: pick the fund type that fits your horizon first, then compare funds inside that type over the same five-year window, against the type average the tool displays. A fund well below its type average over five years is the meaningful red flag. A fund at the top of the table is information, not an instruction.

Your provider’s quarterly fund update. This is the primary document, in the standard format described earlier: returns over one, three, five and ten years where the fund is old enough, the market index comparison, total fund charges and the risk indicator. Read the ten-year and five-year lines before the one-year line. Check the index line to see whether the manager beat the market their fund swims in, after costs. If a provider markets a return figure anywhere else, find the same figure in the fund update and check its period and basis match.
The FMA’s KiwiSaver Tracker. Use this when the question is fees versus returns rather than raw performance. Its scatterplots show, for each fund type, whether paying more has historically bought more. It is the fastest way to test a provider’s claim that its higher fee earns its keep.
Two reading habits protect you across all three tools. First, never compare across fund types or across different periods; most misleading performance claims in marketing are built on one of those two tricks. Second, remember what the data cannot tell you. Funds without a five-year record are absent from five-year tables, new funds often launch with strong short records in favourable markets, and the funds that closed or merged after poor performance quietly leave the dataset. Every league table you will ever see is somewhat kinder than the full history.
What actually drives your long-term result
If picking last year’s winner does not work, what does move the needle over a 20 or 30 year membership? The official guidance points to the same short list, and none of it involves watching performance tables.

Being in the right fund type for your timeframe. This is the decision the return spectrum above prices. A member with 25 years to run who sits in a defensive fund out of caution is giving up the growth premium for decades, and Sorted warns that defensive funds carry their own risk: growing slower than inflation, so the buying power of the balance falls. A member two years from a first home deposit who sits in an aggressive fund is gambling the deposit on the next two years of markets. Both errors cost more than any difference between two competent providers.
Contributing, and capturing the government contribution. Returns apply to whatever balance you have built. The FMA’s figures show contributions of $12.2 billion in a single year doing the heavy lifting for scheme growth, and its report worries openly about the 1.38 million members not contributing at all. For members who qualify, contributing enough to receive the full government contribution, worth up to $260.72 a year on Sorted’s published settings, is a guaranteed return no fund manager can match, because it is a 25 percent top-up on the first portion you put in. The mechanics of contribution rates are a separate topic with their own guide in this series.
Staying invested through the falls. KiwiSaver returns were negative in two of the last ten years at scheme level. The members who switched to defensive funds after those falls locked in the loss and missed the recovery the FMA describes as the historical pattern. The FMA’s investor guidance makes the related point about regular contributions: investing a fixed amount each payday means you automatically buy more units when prices are low and fewer when they are high, which lowers your average cost without any timing skill at all. Its summary is blunt: the hands-off investor often ends up with more than the busy one.
Reviewing on a schedule, not on headlines. An annual check, when your member statement arrives, is the rhythm the FMA recommends. Fund type still right? Fees still competitive within the type? PIR still correct? Performance only enters that review in one way: is your fund persistently behind its own type over long periods, which is the poor-management signal both the FMA and Sorted recognise. Everything else is noise dressed as news. If you are weighing up investing beyond KiwiSaver as well, our guide to investing in New Zealand covers the wider landscape, and our general KiwiSaver guide covers the scheme basics this article assumes.
When changing funds does make sense
Performance data is not useless. It is a maintenance tool, and there are times it should prompt action.
Your fund has trailed others of the same type over five years and longer, by a margin fees alone cannot explain. That is the pattern both regulators’ sources treat as a possible sign of poor management. Your timeframe has changed, for example a first home purchase has moved closer, or retirement is near enough that a deep fall could not recover before you need the money. Fund type follows timeframe, so a changed horizon is a legitimate reason to move regardless of recent returns. Your fund’s fees have risen, or sit well above its type’s average, without a performance or service justification you can verify in the Tracker data. Or your provider’s service has deteriorated in ways that matter to you, which Sorted treats as a real factor and surveys providers on twice a year.
What does not belong on that list is the reason Sorted names directly: you read or heard that another fund has been making higher returns than yours, especially short-term returns. Switching for that reason means buying a performance record that has already happened, at the price of leaving your own fund after its weaker period. Done repeatedly, it is a reliable way to buy high and sell low inside your own retirement account.
Frequently asked questions
Which KiwiSaver fund has performed the best?
It depends entirely on the period and the fund type you pick, and the answer changes every quarter. The honest version of the question is: which funds of my type have performed well over five years or more, after fees and tax? Sorted’s fund finder and Smart Investor answer that with live data drawn from the Disclose register. Any fixed list in an article is out of date on arrival and, on the evidence, a poor guide to the future anyway.
Do top performing funds stay at the top?
Generally, no. The FMA states the research position directly: past performance is no guide to the future, and top-performing funds in one period quite often do badly in the next. Sorted’s analysis of KiwiSaver data found the same tendency and a likely reason: winning funds tend to be riskier, so they have big ups and big downs. Persistent underperformance against a fund’s own type is a more reliable signal than persistent outperformance.
Are KiwiSaver returns shown after fees and tax?
In the tools that matter, yes. Sorted’s fund finder and Smart Investor show five-year returns after fees and after tax, because that is what actually reaches your account. Provider fund updates show returns after charges and tax across one, three, five and ten year periods, and also show a market index return with no deductions, so always check which line you are reading. Be careful comparing KiwiSaver returns with advertised term deposit rates, which are typically quoted before tax.
What return should I expect from a growth fund?
Nobody can promise one, and anyone who does is guessing. For planning purposes, Sorted’s fund finder assumes long-run returns after fees and tax at a 28 percent PIR of 1.5 percent a year for defensive funds, rising through 2.5 percent for conservative, 3.5 percent for balanced and 4.5 percent for growth, to 5.5 percent for aggressive. Those are published modelling assumptions, not forecasts, and actual five-year results for any given fund will land above or below them depending on the markets covered.
Do higher fees buy better performance?
The FMA’s KiwiSaver Tracker, which plots fund returns against fees, shows no general correlation between the two within fund types, and the FMA’s guidance concludes that low-fee funds perform just as well on average as high-fee funds. Scheme-wide fees have fallen from about 1.10 percent of funds under management in 2012 to around 0.7 percent. Fees are also the most persistent feature of a fund, so a fee advantage tends to keep showing up in returns year after year.
How do I check my own fund’s performance?
Find your fund in Sorted’s fund finder or Smart Investor and look at its five-year average annual return after fees and tax, next to the average for its fund type. Then read your provider’s latest quarterly fund update for the longer periods and the market index comparison. Judge it against funds of the same type over the same period, and treat one bad year, or one brilliant year, as weather rather than climate.
Should I switch to last year’s top performing fund?
On the evidence, no. Sorted lists exactly this among its bad reasons to switch, because a return you have read about has already happened and cannot be bought. Switching still makes sense when your timeframe has changed, your fees are out of line, or your fund has lagged its own type persistently over long periods. Those are maintenance decisions. Chasing a headline return is a timing decision, and KiwiSaver members have no edge in timing.
Why did the default funds beat the average balanced fund?
Partly design, partly discipline. The six default funds are balanced funds run under government appointment with regulated settings, diversified portfolios and no member fee. In the FMA’s 2025 annual report, citing Morningstar’s March 2025 KiwiSaver data, the default funds had provided average annual returns of 6.5 percent against 5.7 percent for non-default balanced funds. It is a useful reminder that an unglamorous, diversified, reasonably priced fund is a genuinely hard benchmark for active choices to beat.
Sources
Financial Markets Authority, KiwiSaver Annual Report 2025 (reporting year to 31 March 2025), fma.govt.nz: scheme totals, net investment returns of $6.4 billion against $13.1 billion the prior year, returns positive in eight of the past ten years, total fees of $868.5 million and the decline in fees from about 1.10 percent of funds under management in 2012 to around 0.7 percent, fund switching and transfer volumes, fund type shares of funds under management, and default fund returns sourced by the FMA from Morningstar’s KiwiSaver report for March 2025. Financial Markets Authority, Investing Myth #6: Investing is too difficult and time-consuming, fma.govt.nz: the research position on past performance, the KiwiSaver Tracker and fees, and regular investing. Sorted (Te Ara Ahunga Ora Retirement Commission), How the KiwiSaver fund finder works, sorted.org.nz: fund type bands by growth asset share, five-year after-fees-and-tax return methodology and Disclose register sourcing, assumed fund finder returns by fund type and PIR, horizon guidance, switching guidance, and the government contribution maximum of $260.72 used in the tool.
For more guides for Kiwi businesses and households, see the Finance hub.
Disclaimer
This article is general information about how KiwiSaver fund performance is measured and reported in New Zealand. It is not financial advice, it does not recommend any fund or provider, and it does not take your personal circumstances into account. Past performance figures are historical and are not a guarantee or indication of future results. Fund fees, returns and scheme settings change, so check current figures in the official tools described above, and consider advice from a licensed financial adviser before making significant decisions about your KiwiSaver settings.