Stocking Rate NZ: Stock Units Explained and How to Work Out Yours
Ask a room of farmers how many stock units a cow is and you will get a quick, confident single number. Ask what that number is based on and the room goes quieter. The stock unit is one of the most useful ideas in New Zealand farming, and one of the easiest to misuse, because it looks precise while resting on assumptions about one particular sheep.
This article explains the system from the primary sources that publish it: what one stock unit means, why its published dry matter figures differ slightly, how many stock units a cow works out at from DairyNZ feed demand figures, how to calculate your own stocking rate, and what carrying capacity describes. All figures were checked in October 2026. Where the primary sources publish no single figure for a class, this article says so rather than filling the gap from elsewhere.
What is a stock unit?
A stock unit, usually shortened to SU, is a feed demand unit. It is not a weight, not a head count and not a measure of production. It expresses how much feed an animal needs over a full year, compared with one standard animal.
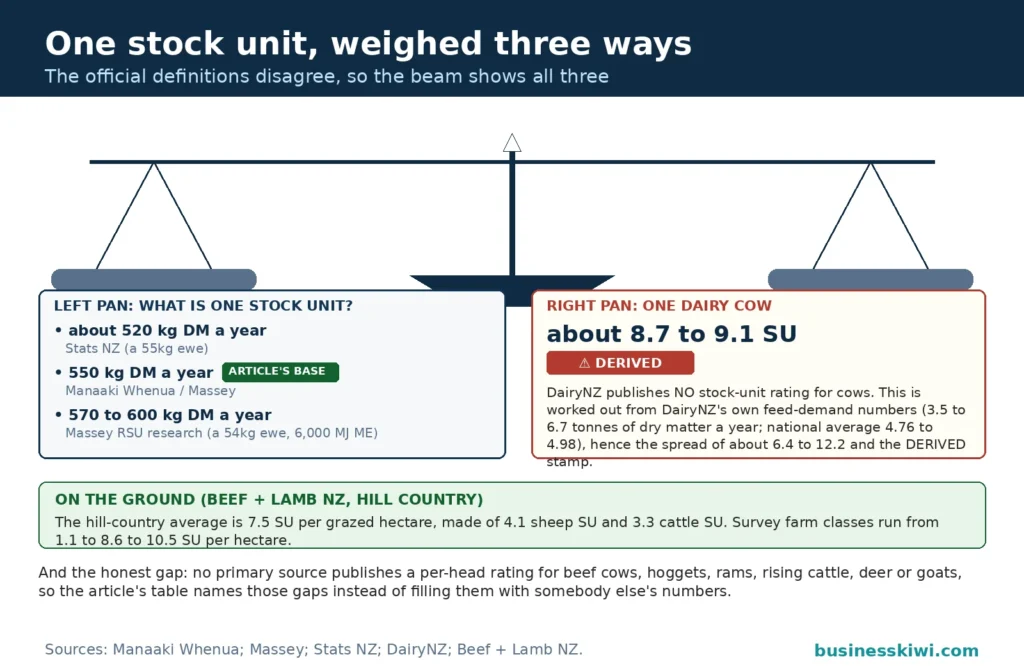
That standard animal is a breeding ewe. The sheep and beef production systems account published by Manaaki Whenua Landcare Research, written by a Massey University author from Beef + Lamb New Zealand Economic Service data, defines one stock unit as one breeding ewe consuming 550 kilograms of dry matter per year. Stats NZ defines a livestock unit as the annual feed requirement of a 55 kilogram ewe rearing a single lamb, about 520 kilograms of good quality pasture dry matter per year. Massey University research on the revised stock unit used in Overseer describes a 54 kilogram standard ewe raising a single lamb to weaning, consuming 570 to 600 kilograms of dry matter, with the revised unit expressed as 6,000 megajoules of metabolisable energy per year.
Three official descriptions, three slightly different totals: about 520, 550, and 570 to 600 kilograms. The spread reflects rounding, assumed ewe weights of 54 to 55 kilograms, pasture quality assumptions, and a shift from dry matter to energy, because the energy in a kilogram of dry matter varies by season, region and feed type.
Treat the total as a range. One stock unit is roughly five and a half hundred kilograms of pasture dry matter eaten over a year, representing a breeding ewe of about 54 to 55 kilograms rearing one lamb. Every other class is a multiple of that demand: twice the feed is two stock units, half the feed is 0.5.
The system exists because most farms run more than one class of stock, and pasture provides over 95 percent of the diet of sheep and beef cattle in the Manaaki Whenua account. A common feed unit lets farmers add different stock together, compare farms, value land and plan feed. Massey research lists those uses directly: comparison between and within farms, rural valuation, and farm system analysis.
How many stock units is a cow?
Start with DairyNZ. Its Facts and Figures feed chapter gives annual dry matter requirements by breed, liveweight and milksolids, at 11.0 megajoules of metabolisable energy per kilogram of dry matter. A 375 kilogram Jersey producing 250 kilograms of milksolids is listed at 3.5 tonnes a year. A 450 kilogram KiwiCross at 400 kilograms of milksolids is listed at 4.8 tonnes, and a 500 kilogram Friesian at the same production at 5.1 tonnes. A 550 kilogram Friesian producing 600 kilograms of milksolids is listed at 6.7 tonnes.
DairyNZ national analysis points the same way. Its December 2024 Econ Tracker update reported average feed demand per cow rising from 4.76 tonnes of dry matter in 2018-19 and 2019-20 to 4.98 tonnes in 2021-22, with average liveweight rising from 418 to 447 kilograms and milksolids per cow around 381 to 397 kilograms, a rise DairyNZ attributed to increasing liveweights and crossbred cows.
Convert those tonnes using the 550 kilogram definition, by simple division. These equivalents are labelled derived arithmetic, not a DairyNZ rating, because DairyNZ generally works in cows per hectare and comparative stocking rate rather than sheep stock units.
- National average cow, 4.76 tonnes: 4,760 divided by 550 equals about 8.7 stock units.
- National average cow, 4.98 tonnes: 4,980 divided by 550 equals about 9.1 stock units.
- Smaller Jersey example, 3.5 tonnes: 3,500 divided by 550 equals about 6.4 stock units.
- KiwiCross example, 4.8 tonnes: 4,800 divided by 550 equals about 8.7 stock units.
- Friesian example, 5.1 tonnes: 5,100 divided by 550 equals about 9.3 stock units.
- Large, high producing Friesian example, 6.7 tonnes: 6,700 divided by 550 equals about 12.2 stock units.
The honest answer: a typical dairy cow is roughly nine stock units on annual feed demand, with a realistic spread from about six and a half to over twelve depending on liveweight and production. A single figure quoted without those two details leaves out what moves the answer most.
A beef cow is a different case, and this article will not invent a figure for her. No primary source read in full here publishes an annual dry matter total for a beef breeding cow as DairyNZ does for milking cows. Use the same division: an annual feed demand figure from a feed budget built on primary guidance, divided by your chosen stock unit base, with both numbers stated. Do not borrow a dairy figure for beef cows.
The same caution applies to ewe hoggets, rams, rising one and rising two year cattle, deer and goats. No primary source read in full here publishes one combined, current table rating all those classes on a single consistent basis. Beef + Lamb New Zealand counts sheep and cattle stock units separately: its hill country fact sheet reports 7.5 stock units per grazed hectare made up of 4.1 sheep and 3.3 cattle stock units, which describes the mix on those farms, not a per head rating for a hogget or a ram. The table below is limited to what the sources support, with the gaps named.
Table notes: checked October 2026. Derived values use DairyNZ annual feed demand and the 550 kilogram base. They shift on the 520 kilogram Stats NZ base or the 570 to 600 kilogram Massey range, so state your base when you quote an equivalent.
Even the standard ewe is not as fixed as the definition suggests. Beef + Lamb New Zealand Fact Sheet 83 (FeedSmart, September 2019) assumes pasture at 11 megajoules per kilogram of dry matter on rolling hill country and varies the requirement by liveweight and lambs carried. Early in pregnancy it lists 10.1 megajoules a day for a 55 kilogram ewe, 11.4 for 65 kilograms and 12.7 for 75 kilograms. By lambing, a 55 kilogram single bearing ewe is at 17.1 megajoules a day, a twin bearing ewe at 21.9 and a triplet bearing ewe at 24.5, with 0.5 added for steep hills and 0.5 deducted for flats. The annual unit smooths that variation out so farms can be compared. It does not remove it.
How to calculate your stocking rate
Stocking rate is total stock units divided by effective hectares: the grazed, productive area, not every hectare on the title. Forestry, ungrazed native vegetation, yards, races and buildings are excluded. Beef + Lamb New Zealand makes the same distinction, and its KPI booklet expresses most measures per effective hectare, noting a per stock unit basis can suit high country and extensive systems better.
Work through it in four steps. First, list every class at a chosen date, with head counts, and record the date, because winter and peak spring counts differ. Second, convert each class to stock units: ewes at their head count, dairy cows using a derived equivalent from annual feed demand, and other classes from estimated annual dry matter eaten divided by your stock unit base, adjusted for part year presence. Third, add the class totals. Fourth, divide by effective hectares. The result is SU per ha.
Worked example one: a sheep and dairy grazing block
A 120 effective hectare block runs 900 breeding ewes and winters 60 dairy cows. Use 1.0 stock units per ewe and 9.0 per cow, the rounded midpoint of the derived national average range above, and state that rounding.
Ewes: 900 multiplied by 1.0 equals 900 stock units.
Dairy cows: 60 multiplied by 9.0 equals 540 stock units.
Total: 900 plus 540 equals 1,440 stock units.
Stocking rate: 1,440 divided by 120 equals 12.0 stock units per hectare.
At 550 kilograms per stock unit, that total implies about 792 tonnes of dry matter eaten in the year (1,440 multiplied by 550). Do that cross check: a rate implying more feed than the farm can grow, plus supplement you plan to buy, is a warning, not a target.
Worked example two: a hill country sheep farm
A 530 effective hectare hill country farm runs 3,300 breeding ewes and 1,100 ewe hoggets carried through as replacements. No hogget rating is published in the sources read in full here, so suppose this farm’s feed budget estimates hoggets, present all year and growing as well as maintaining themselves, at 0.7 of a standard ewe. That 0.7 is strictly an example assumption, not an official rating.
Ewes: 3,300 multiplied by 1.0 equals 3,300 stock units.
Hoggets on the stated assumption: 1,100 multiplied by 0.7 equals 770 stock units.
Total: 3,300 plus 770 equals 4,070 stock units.
Stocking rate: 4,070 divided by 530 equals about 7.7 stock units per hectare.
That sits close to the Beef + Lamb New Zealand hill country average of 7.5 stock units per grazed hectare, a useful sense check that proves nothing about this farm. At a 0.6 hogget assumption the rate is about 7.5 per hectare, and at 0.8 it is about 7.9. Your answer is only as good as its conversions and area figure, so write both down.
For dairy farms, DairyNZ offers a second lens. Comparative stocking rate, or CSR, is kilograms of liveweight per hectare divided by tonnes of dry matter available per hectare. DairyNZ puts the optimum at currently between 80 and 90, with research across five herds over three years showing operating profit per hectare maximised at 76 and milksolids per hectare maximised at 91. CSR accounts for growth potential, supplement use and liveweight, so it compares across farms and regions. Overseer reporting makes a related point, showing revised stock units per hectare on both grazed area and total farm area bases, which diverge where non grazed areas are large.
Carrying capacity: what a farm can run
Stocking rate describes what a farm is running. Carrying capacity describes what it can run, sustainably, on the feed it can grow and source. A farm can sit above its grass only capacity for a time by buying supplement, grazing stock off, or mining pasture cover and animal condition, and below capacity it wastes feed. Neither shows in a single SU per hectare figure unless you also know the feed supply behind it.
The Manaaki Whenua account shows how widely capacity varies. Its regional table puts pasture production at about 2.0 tonnes of dry matter per hectare in the high country, 7.0 tonnes in hill country and 11.0 tonnes on flat to rolling country. Its farm class examples, adapted from the Beef + Lamb New Zealand survey, show a South Island high country class averaging 8,665 hectares and 9,305 stock units at 1.1 per hectare, a North Island hill country class averaging 530 hectares and 4,569 stock units at 8.6 per hectare, and a South Island intensive finishing class averaging 205 hectares and 2,134 stock units at 10.5 per hectare. Same country, same unit, roughly a tenfold difference, driven mainly by how much feed the land grows.
Five things drive that supply. Pasture growth is the engine: annual growth sets the ceiling and its seasonal pattern sets the pinch points, because a farm growing little in winter has a winter problem even if its annual total looks comfortable. Matching lambing and calving dates to the growth curve lifts effective capacity without adding a hectare. Soil and fertiliser come next: the hill country fact sheet records reported class averages of 20 kilograms of elemental phosphorus per hectare on pasture and 12 kilograms of elemental nitrogen per hectare on hill country pasture, stated here as averages, not recommendations.
Climate adds variation. Rainfall, temperature, drought and wet periods move growth away from the long term mean, so assess capacity conservatively and treat good years as a chance to build cover. Topography decides how much of the farm is truly effective: hill country farms are described as about 11 percent flat, 32 percent rolling and 40 percent steep, with only flat and some rolling country cultivable for feed crops. Supplement and crops stretch capacity at a cost, and wastage must be allowed for: DairyNZ cites trials in which about six percent of feed offered under good conditions disappeared uneaten.
Animal factors close the loop. Heavier ewes, heavier cows and higher production per head raise demand per head, as both sets of tables show. Genetic gain lifting liveweight and output without a matching lift in feed supply raises the stock unit total even when head numbers never change, a common reason a farm drifts into being overstocked over a decade while stock numbers stay the same.
How farmers use stocking rate
Comparing farms is the original job. In stock units per effective hectare, farms with different mixes of sheep and cattle can sit alongside survey averages for their class. A hill country farm at 7.7 per hectare can see itself against the 7.5 average, then ask whether its feed supply and livestock mix are actually comparable, rather than chasing another farm’s rate on different land.
Feed budgeting is the second use. Convert a planned stock policy into stock units, then into tonnes of dry matter on your stated base, and set demand against expected growth month by month plus planned crops and supplement. DairyNZ daily tables do the same job at daily level, breaking demand into maintenance, pregnancy, walking, milksolids and liveweight change, with walking costed at 2.0 megajoules per kilometre on the flat, 3.0 on rolling country and 6.0 on hilly or steep country.
Buying, selling and grazing decisions are the third use, at a general level. A block’s realistic stock unit capacity is a starting point for what it might carry if it comes up for lease, grazers can be converted into feed demand over the exact weeks they will be present, and in a dry spell the stock unit weight of each class shows how much demand each sale removes. Valuation, lending and regulation are a fourth use: Massey research notes rural valuation, and Overseer uses revised stock units to compare carrying capacity across dairy and non dairy enterprises. Whenever a figure leaves the farm gate, its base and date matter even more.
Common mistakes
Quoting a rate without its area basis is the first mistake. Title area and effective grazed area can differ widely on farms with forestry, native bush or non productive areas. Always state which area you used.
Treating a borrowed per head rating as official is the second. The primary sources publish the ewe definition and dairy feed demand in detail, but no universal table for every class. A precise looking rating for a beef cow, a hind or a goat that cannot be traced to a primary source is an estimate and should be labelled as one.
Ignoring time on farm is the third. Counting every animal that appears during the year at a full annual rating inflates demand for trading and finishing stock. Adjust for the share of the year each class is present.
Letting liveweight creep pass unnoticed is the fourth. Bigger ewes and cows eat more. Beef + Lamb New Zealand KPI work uses average ewe mating weights above 60 kilograms in its worked examples, well above the 54 to 55 kilogram standard ewe. If your ewes average materially more, a conversion at 1.0 understates their demand.
Confusing a good year with capacity is the fifth. The sixth, on dairy farms, is relying on cows per hectare alone: DairyNZ regards comparative stocking rate as the better indicator because it brings liveweight and total feed available, including supplements, into the same measure.
The bottom line
One stock unit is the annual feed demand of a breeding ewe of about 54 to 55 kilograms rearing a single lamb: roughly 520 to 600 kilograms of dry matter a year depending on the source, or 6,000 megajoules of metabolisable energy in the revised unit. A typical dairy cow is about nine of those units. Stocking rate is total stock units divided by effective hectares, and carrying capacity is the rate your feed supply can sustain.
Frequently asked questions
What is a stock unit in New Zealand?
A stock unit measures annual feed demand. One unit equals the feed needed over a year by a breeding ewe of about 54 to 55 kilograms rearing a single lamb: about 520 to 600 kilograms of dry matter in the primary sources, or 6,000 megajoules of metabolisable energy in the revised unit used by Overseer, checked October 2026. Other classes are multiples of that demand.
How many stock units is a dairy cow?
About nine stock units for a typical cow. DairyNZ reported average feed demand of 4.76 to 4.98 tonnes of dry matter per cow a year. Dividing by the 550 kilogram stock unit base gives about 8.7 to 9.1 stock units. Smaller cows work out lower and large, high producing Friesians can exceed twelve, so state liveweight and production with any figure.
How many stock units is a beef cow?
No single rating is published in the primary sources read in full for this article. Take an annual feed demand figure for your cow class from a feed budget built on primary guidance and divide it by your stated stock unit base. Do not apply a dairy figure to beef cows, because their production pattern differs.
How do I calculate my farm’s stocking rate?
List each class and its head count on a stated date, convert each class to stock units, add the totals, then divide by effective grazed hectares. Exclude forestry, ungrazed vegetation and non grazed areas. Record your conversions, area basis and date.
What is the difference between stocking rate and carrying capacity?
Stocking rate is the load you are running, in stock units per effective hectare. Carrying capacity is the load your feed supply can sustain, given pasture growth, soil, climate, topography and any crops or supplement you genuinely plan to use. The feed supply behind the rate always needs to be stated.
What is a good stocking rate for hill country?
Beef + Lamb New Zealand reports hill country farms averaging 7.5 stock units per grazed hectare, about 4.1 sheep and 3.3 cattle stock units. Survey examples range from 1.1 per hectare on high country to 10.5 on intensive finishing country. A good rate is the one your own pasture growth can feed through winter and a dry year.
Why do sources give different dry matter figures for one stock unit?
They assume slightly different standard ewes and pasture quality, and newer work expresses the unit as energy rather than dry matter. Stats NZ uses about 520 kilograms for a 55 kilogram ewe, the Manaaki Whenua account uses 550 kilograms, and Massey research uses 570 to 600 kilograms for a 54 kilogram ewe, expressed as 6,000 megajoules of metabolisable energy. State the base you use.
What is comparative stocking rate on a dairy farm?
It is DairyNZ’s dairy measure of the balance between feed demand and supply: kilograms of liveweight per hectare divided by tonnes of dry matter available per hectare. DairyNZ puts the optimum at currently between 80 and 90, with research showing operating profit per hectare maximised at 76 and milksolids per hectare maximised at 91.
This article is general information about how stock units and stocking rate are defined and calculated in New Zealand. It is not farm management, financial or veterinary advice for any specific farm. Stock unit conversions, feed budgets and stocking decisions depend on your land, stock and feed supply, and should be worked through with a qualified farm adviser using current primary guidance for your region and farm class.
Sources
- Manaaki Whenua Landcare Research, Sheep and Beef Cattle Production Systems, landcareresearch.co.nz
- Stats NZ, Livestock Unit (LSU) Data Dictionary, stats.govt.nz
- Massey University, Quantification of Relative Stock Units for Horses to Permit Correct Application Within Pasture-Based Production Systems, massey.ac.nz
- Overseer, Animal Report: Description of Stocking Rate for All Enterprises Report, overseer.org.nz
- DairyNZ, Comparative Stocking Rate, dairynz.co.nz
- DairyNZ, Facts and Figures Chapter 4: Cow Feed Requirements, dairynz.co.nz
- DairyNZ, Pasture Remains King, Econ Tracker Quarterly Update December 2024, dairynz.co.nz
- Beef + Lamb New Zealand, Hill Country Sheep and Beef Farms Fact Sheet, beeflambnz.com
- Beef + Lamb New Zealand, A Core Set of KPI Measures for Red Meat Farming Businesses, beeflambnz.com
- Beef + Lamb New Zealand, Fact Sheet 83: FeedSmart Feed Table, Pregnant Ewes, beeflambnz.com