Top Schools in NZ: Why There Is No Official Ranking, and How to Judge a School on the Evidence

Search for the top schools in New Zealand and you will find plenty of confident lists. None of them comes from the Ministry of Education. The Ministry does not rank schools, does not publish a league table, and does not name a best school in any town, region or category. What it publishes instead is evidence: a directory profile, achievement and attendance data, and independent review reports for every school in the country. This guide explains how to use that evidence properly, and why the shortcuts, especially tables built on raw NCEA pass rates, so often point parents in the wrong direction.
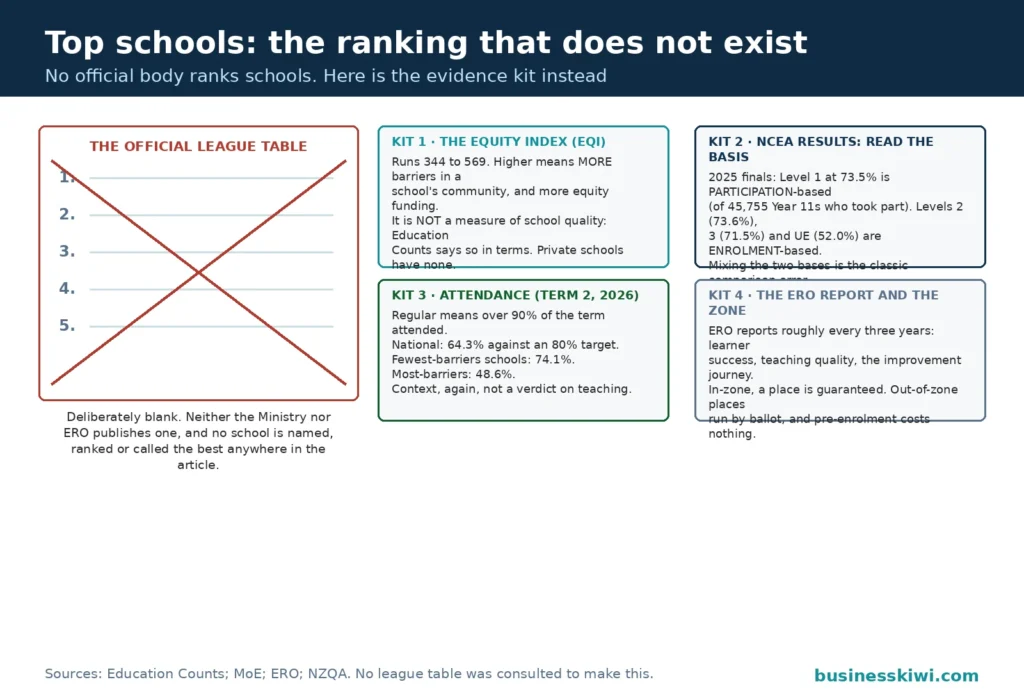
Why there is no official list of top schools
A ranking needs a single measure that means the same thing at every school. New Zealand does not have one, and the official data itself shows why. A school’s results are shaped heavily by who walks through the gate. NZQA, which runs NCEA, reports a persistent gap in attainment between students at schools whose communities face more socioeconomic barriers and students at schools facing fewer. The Ministry’s attendance reporting shows the same pattern from another angle: in Term 2 of 2026, 74.1 percent of students at schools in the lowest-barrier group were attending regularly, compared with 48.6 percent at schools in the highest-barrier group. Those gaps exist before teaching quality enters the picture at all.
That is the first problem with league tables assembled from raw results. They mostly rank intakes. A secondary school drawing its students from an affluent suburb will usually post higher NCEA and University Entrance percentages than a school serving a low-income community, even if the second school is adding more value to its students. The raw number cannot tell you which school teaches better. It tells you who enrolled.
Three further problems sit underneath:
- Cohort size. Small cohorts swing wildly. The Ministry notes that in its attendance data, the very highest and very lowest school rates are predominantly at schools with 25 or fewer students. One family’s circumstances can move a small school’s percentage by several points in a single year.
- Participation differences. Schools differ in which students they enter for which qualifications. NCEA Level 1 is optional, and NZQA reports that just under a third of Year 11 students do not take part in it at all. A school that enters nearly everyone will show a lower pass rate than a school that enters only its strongest students, without teaching any worse.
- Subject and pathway mix. Schools with large trades, vocational or supported-learning programmes are preparing many students for destinations that NCEA percentages capture poorly. A school can be doing excellent work and still post modest headline numbers.
None of this means results are useless. It means they are evidence to be read in context, not a score to be sorted. The rest of this guide is about reading them in context.
Start with the official record: the Education Counts profile
Every school in New Zealand has a profile in the Ministry’s Education Counts directory, and it is the right place to begin. Search the directory by school name or by your address, and you get the school’s official record: its institution number, school type (for example a contributing primary covering Years 1 to 6, an intermediate covering Years 7 to 8, or a secondary school), its authority (state, state-integrated or private), whether it is co-educational or single-sex, whether it has boarding facilities, the language of instruction, including whether some or all students learn in Māori medium, its contact details and website, and a link to its Education Review Office report.
Two fields deserve a closer look. The zoning field tells you whether the school operates an enrolment scheme, which matters a great deal if you live outside its zone, as explained below. The donations field tells you whether the school may ask for donations or has opted into the donations scheme, under which schools with an Equity Index number of 432 or higher can receive extra funding instead of seeking donations, apart from overnight camps. From the profile you can also reach the school’s student population data, drawn from the roll returns schools make each year (the July roll is the head count used for national reporting), along with its engagement data, such as attendance, and its achievement data. Treat the profile as the school’s identity card. Everything else in this guide hangs off it.
Know what kind of school you are looking at
Comparisons go wrong quickly when schools of different types are lined up as if they were the same product. The Ministry’s guidance for parents describes the main categories:
- State schools are owned and funded by the government, teach the national curriculum, and are non-religious. Most New Zealand schools are state schools, and domestic students attend free, although schools may ask for voluntary donations and you will pay for items such as stationery, uniforms and trips.
- State-integrated schools are owned by a private entity such as a church or trust but funded by the government and teaching the national curriculum. Each has a special character, values and philosophy, often based on a religion. Most charge fees, usually called attendance dues, to maintain their special character and their privately owned land and buildings.
- Charter schools, or kura hourua, are government-funded but operate independently, with more freedom to set their own curriculum and teaching methods. They cannot charge tuition fees to domestic students.
- Private schools receive some government funding but rely mainly on fees paid by parents. They design their own learning programmes and do not have to follow the national curriculum.
- Kura kaupapa Māori and Māori-medium education involve teaching in te reo Māori for at least 51 percent of the time, which the Ministry classes as immersion levels 1 and 2. In English-medium schools, te reo Māori may be a subject, or used for up to 50 percent of teaching, classed as immersion levels 3 to 5.
A private school with selective entry, a kura kaupapa Māori serving its rohe, and an open-entry state school are answering different briefs. Judge each against its own purpose first, and against similar schools second.
The Equity Index: the number most often misread
On a school’s profile you will find its Equity Index number, commonly shortened to EQI. Since January 2023 the Equity Index has replaced the old decile system. Every state and state-integrated school is given a number between 344 and 569, worked out from Stats NZ’s Integrated Data Infrastructure using the circumstances of the students enrolled. The higher the number, the greater the socioeconomic barriers those students face on average, and the more equity funding the school receives per student to help overcome them.
The Ministry is blunt about what the number is not: it is not a measure of school quality. Education Counts repeats the warning in its own technical guidance, noting that the Equity Index bands it uses for reporting are for grouping many schools together, and that the band a school sits in is not an indicator of that school’s quality. Private schools do not have an Equity Index number at all, because they sit outside the equity funding system. Numbers are updated annually, so a school’s EQI can shift slightly from year to year.
Used properly, the EQI is a context lens. If two schools post similar NCEA results but one has an EQI of 380 and the other an EQI of 520, the second school is achieving those results with students who face far more barriers, and that is worth real weight in your judgement. If a school’s results are being compared in a media table with no EQI in sight, you are looking at half the story.
ERO reports: the closest thing to an inspection
The Education Review Office, or ERO, is the government’s external evaluation agency for education. Its reviewers are experienced educators who visit schools, gather evidence, and make independent judgements about how well each school is doing for its learners. ERO reviews state and state-integrated schools and kura, and also reviews private and independent schools. Reports are published on ERO’s website, and each school can comment on its report before publication.
Under ERO’s current approach, a published School Report appears approximately every three years. It covers statements about learner success and wellbeing, including attendance, assessment, achievement and progress, a summary of the quality of teaching and learning, where the school is on its improvement journey and what its future priorities are, and the board’s confirmation that it meets its legislative and regulatory requirements. ERO also publishes a short guide that explains the judgement terms used in its reports, which is worth ten minutes of any parent’s time before reading one.
Read an ERO report for direction, not just verdicts. What did reviewers say the school does well? What did they say it must improve? How does that compare with the previous report: has the school acted on earlier priorities? A school criticised three years ago that has visibly fixed the problem may be a safer bet than a school with a glowing report and no follow-through since. Note the date, too. A report nearing three years old describes a school that may have changed leadership, staff and roll in the meantime.
NCEA and University Entrance data: read the basis before the number
For secondary schools, the headline data is NCEA attainment, and the single most common reading error is ignoring the basis of the percentage. NZQA publishes national results on two different bases, and they answer different questions.
Enrolment-based results count every student enrolled in the year level, whether or not they were entered for the qualification. Participation-based results count only students who actually took part in a full assessment programme. NZQA uses the participation basis for NCEA Level 1, because Level 1 is optional and many Year 11 students are not entered for it, and the enrolment basis for Level 2, Level 3 and University Entrance, where participation is high.
The finalised national figures for 2025, published by NZQA, give you the benchmark to hold any school’s numbers against. Among Year 11 students participating in NCEA Level 1, 73.5 percent attained it. On the enrolment basis, 73.6 percent of Year 12 students attained NCEA Level 2, 71.5 percent of Year 13 students attained Level 3, and 52.0 percent of Year 13 students attained University Entrance. NZQA also reported that 73.8 percent of students had achieved the literacy and numeracy co-requisite by the end of Year 11 in 2025. These are national averages across every kind of school and community, not targets, and a school well above or below them is telling you something about its intake as much as its teaching.
When you compare a school’s achievement data, available through its Education Counts profile, apply four checks:
- Same basis. Never set a participation-based figure beside an enrolment-based one. If a school quotes its own pass rate on its website, find out which basis it uses before comparing it with anything.
- Same year, and several years. One year’s cohort is one group of teenagers. A pattern across three to five years says far more than a single result.
- Similar company. Compare schools with broadly similar Equity Index numbers and roll sizes. That is the nearest thing to a fair race the data allows.
- Depth, not just the pass line. Look beyond whether students passed to how well they passed: certificate endorsements at Merit and Excellence, and New Zealand Scholarship results, both of which feature in NZQA’s published statistics, give a sense of achievement at the top end that a pass rate hides.
Attendance: the quiet indicator
Achievement data tells you what students gained. Attendance data tells you whether they were there to gain it, and the Ministry publishes it every term. The headline measure is regular attendance, defined as a student attending more than 90 percent of the term, measured in half-days. Nationally, 64.3 percent of students met that mark in Term 2 of 2026, against a government target of 80 percent.
A school’s attendance pattern, reachable through its Education Counts engagement data, is worth your attention for two reasons. First, the Ministry’s own research links attendance directly to attainment: each additional half-day away is associated with fewer NCEA credits later. Second, attendance is one of the few indicators that reflects the whole school culture: whether students feel the place is worth turning up to. Read it with the same context rule as everything else. Rates run lower, on average, at schools serving communities with more socioeconomic barriers, which is exactly what the Equity Index describes, so compare a school’s attendance with schools like it, and look at whether its trend is improving.
Zones and enrolment schemes: the practical gatekeeper
None of the analysis matters if your child cannot get in. If a state school has an enrolment scheme, living inside its home zone guarantees your child a place. Living outside it does not rule the school out, but it puts you into the out-of-zone process, and that process is set by law rather than by the school’s preference.
Each year the school decides how many out-of-zone places it can offer, and it must advertise the number of places, the application deadlines and the ballot dates. Applications are taken in a priority order set by the Education and Training Act 2020: students accepted into a special programme first, then siblings of current students, siblings of former students, children of former students, children of board employees and board members, and then all other students. If a priority group has more applicants than places, a ballot is held within that group. Unsuccessful applicants go on a waiting list in ballot order, which lasts until the next ballot. Schools cannot charge a fee or seek donations for any part of the pre-enrolment process.
Two variations matter. Schools without an enrolment scheme generally take all comers. And enrolment schemes at state-integrated schools and kura kaupapa Māori work differently: they may not include a home zone or a ballot at all, because these schools select by fit with their special character or kaupapa. The Ministry can also direct a school to enrol a student in a small number of defined circumstances, such as where the student actually lives in zone. Check the zoning field on each school’s directory profile early, before you fall for a school your address rules out.
Primary and intermediate schools: different evidence
There is no NCEA below secondary school, so the comparison toolkit changes. For primary and intermediate schools, lean on three sources. The first is the ERO report, which covers primary schools in the same published cycle and comments on how well learners are succeeding, including in reading, writing and mathematics as part of the school’s own assessment picture. The second is the school’s own charter and annual plan, published by the school, which set out its goals and targets and report back against them; a school that sets specific targets and honestly reports missing some is showing you a healthier culture than one reporting universal success. The third is the same directory and attendance data described above, which applies to every school, not just secondaries. Add the school’s reports to parents about your own child’s progress once enrolled, and you have most of the evidence that exists. Anyone offering a ranked list of primary schools is working from thinner material than they admit.

A worked walkthrough: comparing two schools on the evidence
Suppose you are choosing between two secondary schools. Call them School A, your in-zone option, and School B, which would need an out-of-zone ballot place. Work through the same steps for each and write down what you find.
Step 1: the identity card. From each directory profile, note the school type, authority, roll size, whether it is single-sex or co-educational, its language of instruction, and its zoning status. Confirm whether School B’s ballot realistically offers places at your child’s year level.
Step 2: the context lens. Record each school’s Equity Index number. If the numbers are far apart, expect the raw results to differ too, and resolve to judge each school against schools with similar numbers, not just against each other.
Step 3: the review. Read both ERO reports, newest first. Note the date, the strengths, the improvement priorities, and whether the current report shows progress on the issues raised last time. A dated report is a weaker signal; say so in your notes rather than treating it as current.
Step 4: the results, on one basis. From the achievement data, take the same measure for both schools, same year, same basis: for example, the enrolment-based share of Year 12 students attaining NCEA Level 2, and of Year 13 students attaining University Entrance. Set both beside the national figures for that year. Then look back over several years. You are looking for a pattern: steady, improving, or sliding.
Step 5: the depth and the presence. Check endorsement results if they are published, then look at regular attendance for both schools and its recent trend.
Step 6: the fit check. Read each school’s charter or strategic documents for the things data cannot rank: subject range at senior level, support for your child’s needs and interests, and the pathways it emphasises.
At the end of this you will not have a score. You will have something better: a short, honest account of what each school demonstrably does, for the students it actually serves, and where the gaps in your knowledge are. Those gaps are what your visit is for.

What the numbers cannot tell you
Data can tell you a great deal about a school’s context, results and trajectory. It cannot tell you whether your child will be known by name, whether the teacher in front of them in Year 9 will be superb, how the school handles bullying, or whether its culture fits your family’s values. It cannot measure the quality of a single classroom, and it says little about sport, music, or the strength of a particular department your child cares about.
So treat the official evidence as the first filter, not the decision. Visit on an open day and again, if you can, on an ordinary school day. Ask what the school is working on improving, and listen for an answer that matches its ERO priorities. Ask how it supports students who fall behind and stretches those who race ahead. Ask other parents what the school does when something goes wrong. A school that is straight about its weaknesses, in its documents and in person, is usually a school that is dealing with them.
Frequently asked questions
Is there an official list of the top schools in New Zealand?
No. The Ministry of Education does not rank schools or publish a league table. It publishes data and review reports school by school, through Education Counts and the Education Review Office, and leaves the judging to you. Any ranked list you find has been assembled by someone else, usually from raw results that the official publishers warn against reading out of context.
What does a school’s Equity Index number mean?
It is a number between 344 and 569 that estimates the socioeconomic barriers a school’s students face on average, based on the circumstances of the students enrolled. A higher number means more barriers and more equity funding per student. It replaced deciles in 2023, and the Ministry states clearly that it is not a measure of school quality. Private schools do not have an Equity Index number.
Does a higher NCEA pass rate mean a school is better?
Not on its own. Pass rates strongly reflect a school’s intake, its Equity Index, its cohort size and which students it enters for which qualifications. A high rate at a school serving an advantaged community may say more about the students than the teaching, and a lower rate at a high-EQI school may sit alongside excellent progress for its learners. Compare like with like, on the same basis, over several years.
How often does ERO review a school?
ERO publishes a School Report for each school approximately every three years. Reports are free to read on ERO’s website, and the school’s Education Counts profile links to its report. Check the date on the report you read, because a report describes the school as reviewers found it at that time.
What is the difference between enrolment-based and participation-based NCEA results?
Enrolment-based results count all students in a year level, including those never entered for the qualification. Participation-based results count only students who took part in a full assessment programme. NZQA reports NCEA Level 1 on a participation basis, because Level 1 is optional, and Level 2, Level 3 and University Entrance on an enrolment basis. The two bases give different percentages for the same school, so never compare one against the other.
Can my child go to a school outside our zone?
Possibly. If the school has an enrolment scheme, it may offer out-of-zone places each year, allocated in a legal priority order with a ballot where a group is oversubscribed. Living in zone guarantees a place; living out of zone guarantees nothing. Schools without an enrolment scheme generally accept all enrolments, and state-integrated schools and kura kaupapa Māori may select by special character or kaupapa instead of a zone.
How do I compare primary schools when there are no exam results?
Use the ERO report, which covers primary schools in the same cycle as secondaries, the school’s own charter and annual reporting against its targets, and its attendance data on Education Counts. Then visit. At primary level the official evidence is thinner by design, because there is no national qualification to measure, which is exactly why confident primary school rankings deserve scepticism.
Do private schools appear in the same data?
Partly. Private schools have directory profiles and are reviewed by ERO, but they have no Equity Index number, they design their own learning programmes rather than following the national curriculum, and many offer qualifications other than or alongside NCEA. Compare their data with extra care, because the measures were built around the state system.
Sources
- Ministry of Education, Education Counts (educationcounts.govt.nz): school directory and school profiles, including the Find a school tool and school roll data
- Ministry of Education, Education Counts (educationcounts.govt.nz): School Equity Index Bands and Groups guidance
- Ministry of Education, Education Counts (educationcounts.govt.nz): Students attending school regularly, Term 2 2026 attendance report
- Ministry of Education (education.govt.nz): Types of primary and secondary education
- Ministry of Education (education.govt.nz): Enrolment schemes
- New Zealand Government (govt.nz): School zones, reviews and equity funding
- Education Review Office (ero.govt.nz): How ERO reviews
- Education Review Office (ero.govt.nz): Reporting, including the guide to ERO’s school reports
- NZQA (nzqa.govt.nz): NCEA and University Entrance attainment in 2025
This article is general information about how school data is published in New Zealand. It is not advice about any individual school, and it does not rank or recommend schools. Figures quoted are national statistics published by NZQA and the Ministry of Education for the years stated, and school-level data changes from year to year, so check the current Education Counts profile and ERO report for any school you are considering.