Electricity Prices in NZ: What Makes Up the Price and Why It Varies
The quick answer
Every cent you pay per kilowatt hour (kWh) is a bundle, not a single charge. Inside the price sits the cost of generating the electricity and trading it on the wholesale market, the cost of moving it across Transpower’s national grid, the cost of the local lines network that delivers it to your street, your retailer’s operating costs and margin, metering, industry levies, and GST on top.
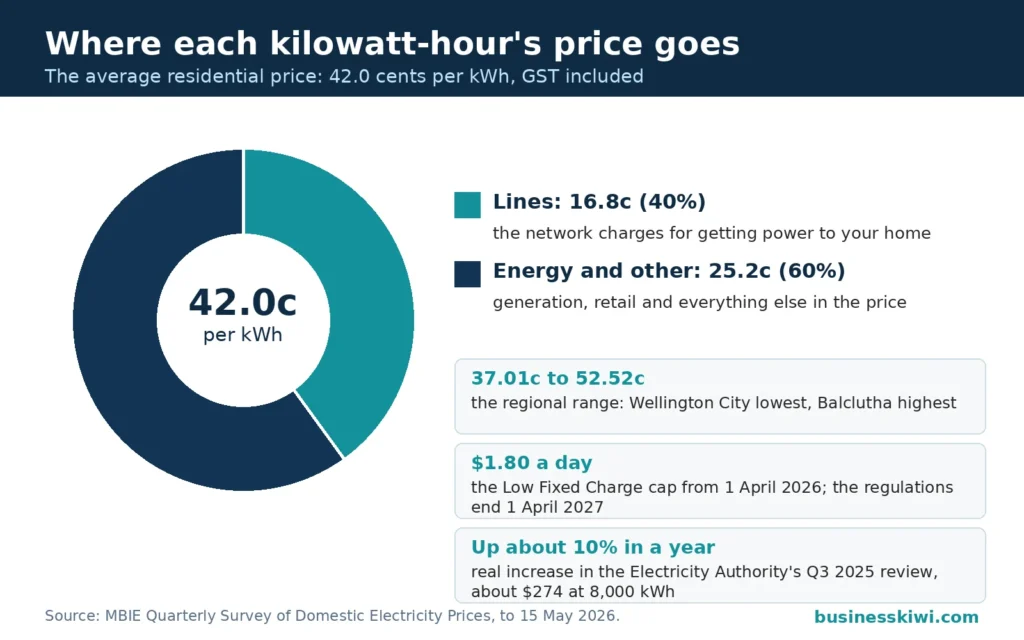
MBIE’s Quarterly Survey of Domestic Electricity Prices (QSDEP) puts the national average residential price at 42.0 c/kWh including GST on 15 May 2026. Of that, the lines component (transmission and distribution together) accounts for 16.8 c/kWh, or 40 percent. The remaining 25.2 c/kWh is what MBIE calls energy and other costs, which covers the wholesale energy itself plus retailing and metering. Those proportions shift a lot by region, and the rest of this article explains why.
Reading the headline number properly
The QSDEP is a survey of advertised tariffs, not a record of what households actually paid. MBIE models a household using 22 kWh a day, or about 8,000 kWh a year, on the cheapest low user plan available in each town without a fixed term contract, paying on time and collecting prompt payment discounts. That modelling choice matters. A household on a standard plan, or one that misses the prompt payment discount, will usually face a higher effective rate than the QSDEP figure for its town.
MBIE splits each town’s price by collecting lines charges directly from network companies, then treating the rest of the retail price as energy and other costs. Metering charges sit inside the energy and other component, not the lines component. All of the QSDEP figures include GST, so the split between lines and energy is the same share of the bill either way. Lines company discounts and energy trust distributions are left out of the series so towns can be compared on a like-for-like basis.
Part one: the energy itself, set on the wholesale market
Before electricity reaches any network, it is traded. The Electricity Authority describes the wholesale market as the place where generators sell electricity and retailers buy it, with roughly 330 participants including about 80 generation companies, 62 retailers and 6 gentailers (companies that both generate and retail).
The core of that market is the spot market. Spot prices are calculated every half hour, so there are 48 trading periods a day, and the price differs by location on the national grid as well as by time. The Authority notes that prices are set on the spot, at a particular time and place. When demand is high and supply is tight, for example on a cold winter evening or during a dry period when hydro storage is low, spot prices rise. When wind, water and spare capacity are plentiful, they fall, sometimes close to zero.
Households almost never see those half-hourly prices directly. Retailers manage the volatility with hedge contracts, financial agreements that smooth out some or all of the movement in spot prices. The Authority compares a hedge to insurance against the financial harm of high prices. What a retailer pays for energy over a year is therefore a blend of spot purchases and hedged positions, and that blended cost is the biggest single input into the energy and other component of your price. It is also why a dry year can push retail prices up months later, as retailers renew hedges at levels that reflect scarcer supply.
Part two: transmission on the national grid
Transpower owns and operates the national grid, the high voltage network of about 12,000 kilometres of lines that moves bulk electricity from power stations to the local networks and to a small number of large directly connected industrial users. Getting power across that grid is the transmission component of the lines charge on your bill.
How Transpower recovers its costs is set by the Transmission Pricing Methodology (TPM), which the Electricity Authority designs and Transpower implements. The current TPM has applied since 1 April 2023. Its main building blocks are connection charges, paid by the customers connected to specific grid assets; benefit-based charges, which allocate the cost of new and some historic grid investments to the customers expected to benefit from them; and residual charges, which recover whatever revenue is left over and are allocated largely according to each customer’s maximum demand. The total revenue Transpower is allowed to recover is set by the Commerce Commission, not by Transpower itself.
Most households never see a transmission charge itemised. Local lines companies pay Transpower, choose how to pass those costs through inside their own distribution charges, and retailers then repackage the whole thing into the plans they sell. Transmission is one reason the lines component differs between towns, because the benefit-based charges attach to particular investments in particular places.
Part three: distribution, the local lines network
The distribution network is the poles, wires, cables and substations that take electricity from the grid exit point to your meter. New Zealand has 29 electricity distribution businesses (EDBs), each a natural monopoly in its own area. You cannot choose your lines company, so the Commerce Commission regulates what most of them can charge under Part 4 of the Commerce Act 1986.
For the non-exempt lines companies, the Commission sets a default price-quality path (DPP). The current path, DPP4, runs from 1 April 2025 to 2030. A price-quality path caps the revenue a lines company can recover and sets quality standards, measured through measures such as the duration and frequency of outages, that the company must meet. The point of the pairing is that a monopoly cannot lift prices simply by letting service deteriorate, and cannot chase revenue without limit. Lines companies owned by their consumers are generally exempt from price-quality regulation, though they still have to publish information under information disclosure rules.
Distribution is capital hungry. A network has to be built and maintained for the busiest moment of the year, not the average moment, and much of the cost is fixed whether households use a lot of power or a little. That fixed-cost character explains a lot about both the size of the lines component (16.8 c/kWh of the 42.0 c/kWh national average in May 2026, per MBIE) and the regional pattern described below.
Part four: retail, metering, levies and GST
The last slice of the price belongs to the competitive end of the market. Your retailer’s slice has to cover buying and hedging energy, billing, customer service, bad debt, and a margin. Retail is the part of the bill where competition actually bites, which is why plan prices for the same town can differ between retailers even though the lines charges underneath them are identical.
Metering pays for the meter at your property and the systems that read and process its data. As noted above, MBIE counts metering inside the energy and other component of the QSDEP split. Industry levies, including the levy that funds the Electricity Authority, are recovered through the supply chain as pass-through costs; MBIE describes rates and levies as part of the pass-through costs sitting inside lines charges. Finally, GST at 15 percent applies to the whole bill, and every QSDEP figure quoted in this article includes it.
Why where you live changes the price
The single biggest reason prices differ around the country is the cost of the local network relative to the number of people sharing it. A dense city network spreads the cost of each substation and feeder across thousands of connections. A rural network may run kilometres of line to reach a handful of farms.
The QSDEP figures for 15 May 2026 show how wide the gap gets. Wellington City recorded the lowest total residential price in the survey at 37.01 c/kWh, with a lines component of 12.3 c/kWh. Balclutha, on the OtagoNet network, recorded the highest at 52.52 c/kWh, with lines making up 25.6 c/kWh of it. Kerikeri (50.56 c/kWh, lines 23.3 c/kWh) and Cromwell (48.81 c/kWh, lines 24.7 c/kWh) sit near the top for the same reason: long networks, fewer customers per kilometre. Nelson (38.78 c/kWh, lines 11.5 c/kWh) and Ashburton (38.06 c/kWh, lines 12.3 c/kWh) sit near the bottom alongside Wellington.
Look at the pattern and a clear story emerges. The energy and other component is fairly uniform across the country, ranging from about 21.7 c/kWh in Paraparaumu to about 29.5 c/kWh in Tauranga. The lines component swings far more, from 11.5 c/kWh in Nelson to 25.6 c/kWh in Balclutha. Where you live mostly changes what you pay for delivery, not what you pay for energy.
Fixed charges, per-kWh charges and the end of the low user rules
Retail prices are usually built from a fixed daily charge (cents per day, payable whether you use power or not) plus variable charges for each kWh used. How a retailer balances those two pieces changes who pays what. A high fixed charge with a lower per-kWh rate suits heavy users. A low fixed charge with a higher per-kWh rate suits light users, which is why the structure of a plan can matter as much as its headline rate.
Since 2004, regulations have required retailers to offer a low fixed charge tariff option for domestic consumers. A low user is a household using less than 8,000 kWh a year in most of the country, or less than 9,000 kWh a year in the lower South Island. Under the regulations, the fixed charge on those plans was capped, originally at 30 cents a day plus GST.
The Government decided in 2021 to phase the regulations out over five years, because the cap forced other customers to subsidise low user plans and discouraged more cost-reflective pricing. MBIE’s published phase-out schedule lifts the maximum low user fixed charge, excluding GST, in 30 cent steps: $0.60 a day from 1 April 2022, $0.90 from 1 April 2023, $1.20 from 1 April 2024, $1.50 from 1 April 2025 and $1.80 from 1 April 2026. On 1 April 2027 the regulations are removed altogether, and power companies will no longer be required to offer a low fixed charge option at all, though some may choose to keep one.
The Electricity Authority has told distributors it does not expect an immediate and full adjustment on 1 April 2027, and that transparency about pricing changes is required as the cap disappears. In practice, expect fixed daily charges to keep drifting up and per-kWh rates to soften in relative terms, with the exact pace set by each network and retailer.
Controlled load, day and night rates, and time-of-use pricing
Not every kWh on a plan costs the same. MBIE’s survey methodology describes the metering setups behind the most common structures. On a controlled tariff, the network can switch off certain circuits, typically the hot water cylinder, for periods at peak times, and in return that electricity is charged at a lower rate. MBIE models uncontrolled and controlled households on a 60/40 split between general use and controlled hot water use. An all-inclusive tariff folds the controlled discount into a single rate. Day and night metering charges one rate during the day and a cheaper rate overnight, which MBIE models as a 70/30 split.
Time-of-use pricing goes further, setting different per-kWh rates for peak, shoulder and off-peak periods so the price signal follows the real cost of supplying power at that moment. The Electricity Authority’s distribution pricing principles push networks toward pricing that is subsidy-free and increasingly cost-reflective, and the removal of the low fixed charge regulations takes away a barrier that had held back more innovative tariff designs. Households with rooftop solar also meet the mirror image of these prices: the buy-back rate a retailer pays for exported electricity, covered in our guide to solar buy back rates.
How prices have moved
Residential prices have risen noticeably in the last couple of years, and lines charges have done most of the lifting. In its market performance quarterly review for Q3 2025, the Electricity Authority reported that inflation-adjusted domestic electricity prices rose by 10 percent over the previous 12 months, worth an extra $274 a year for a typical household using 8,000 kWh. Without the inflation adjustment, nominal prices rose 13 percent over the same period. The Authority also noted that the lines component had increased significantly in Q2 2025, which lines up with the start of the DPP4 regulatory period on 1 April 2025, when the Commerce Commission’s new revenue allowances for lines companies began to flow into retail prices.
The QSDEP tells the same story at a shorter horizon. Between 15 February 2026 and 15 May 2026, the national average residential price rose from 40.6 c/kWh to 42.0 c/kWh, a 3.5 percent increase in one quarter. The lines component rose 10.7 percent in that quarter, from 15.2 c/kWh to 16.8 c/kWh, while the energy and other component actually eased slightly, down 0.8 percent to 25.2 c/kWh. In other words, recent bill pressure has come overwhelmingly from the cost of the networks, not the cost of energy.
Business electricity pricing is built differently
Commercial and industrial customers buy under the same physical system, but the charging structure puts more weight on capacity. Large users participate directly in the wholesale market or buy through retailers on negotiated contracts, and many manage their energy cost with hedge contracts the same way retailers do, as the Electricity Authority describes. Some very large industrial users connect directly to Transpower’s grid rather than to a local network.
On the network side, the Transmission Pricing Methodology allocates residual transmission charges according to maximum demand, so a business that drives high peaks pays a larger share of grid costs than one with a flat load profile, even if both use the same total energy across a year. Distribution pricing for larger connections follows the same logic, with demand and capacity elements sitting alongside per-kWh charges. For a business, when you use power and how sharply you peak can move the bill as much as how much you use in total. There is no single business price to quote: contracts are negotiated, and the right comparison is between contract structures, not headline rates.
How to read your own bill against this anatomy
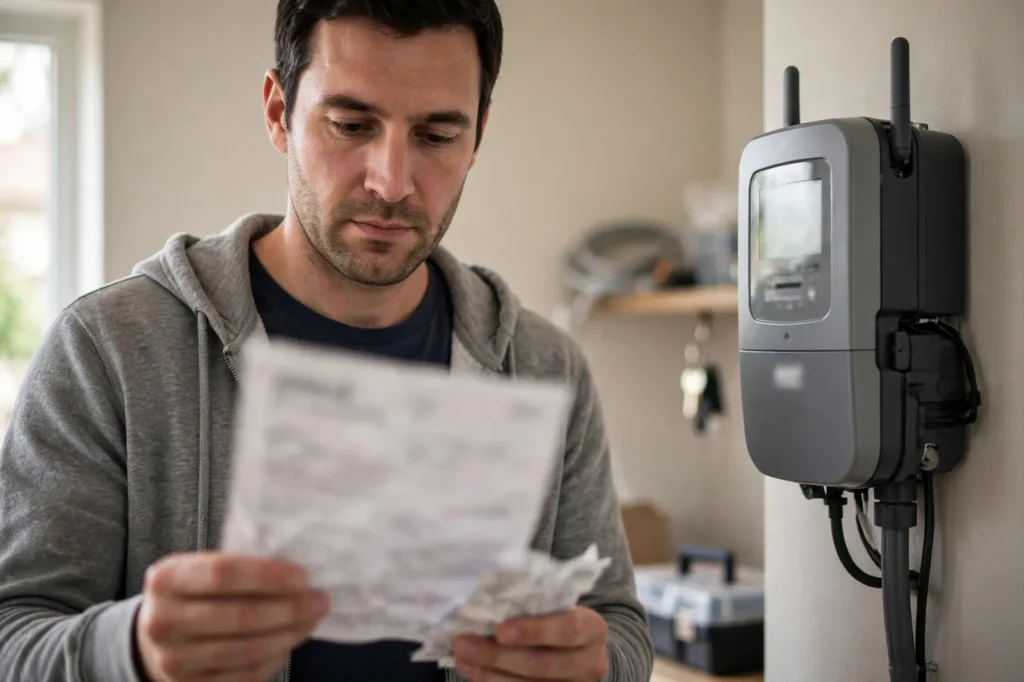
Most bills itemise only two or three lines, but each maps onto the components above. The daily fixed charge is your contribution to the fixed costs of the network and retailing, spread evenly across days. The variable charges, whether a single rate or separate uncontrolled, controlled or time-of-use rates, bundle your share of wholesale energy, transmission, distribution, metering and levies into each kWh. A separate controlled rate, where it appears, is the discounted price for the load your network can switch off.
Two checks are worth making. First, compare the total you actually paid over a year, divided by the kWh you used, against the QSDEP figure for your town, remembering that MBIE’s number assumes a low user plan and full prompt payment discounts. Second, look at the balance between your fixed and variable charges. As the low fixed charge phase-out completes in April 2027, that balance is the part of your bill most likely to change shape.
If you want to see what these prices add up to over a month or a year for households of different sizes, our average power bill guide works through the bill estimates. This article deliberately stays with the anatomy: the averages live there, the explanation lives here.
FAQs
Why is the lines component so much higher in rural areas?
Because network costs are mostly fixed. Poles, wires and substations cost roughly the same to build and maintain whether they serve fifty households or five thousand. In low-density areas each connection carries a larger share of that fixed cost, and MBIE’s QSDEP data shows the effect directly: on 15 May 2026 the lines component was 11.5 c/kWh in Nelson but 25.6 c/kWh in Balclutha.
Does the spot price I hear about in the news change my bill straight away?
No. Spot prices are set every half hour on the wholesale market, but retailers buy much of their energy through hedge contracts that smooth the volatility, as the Electricity Authority explains. A spell of high spot prices usually shows up in retail prices gradually, when plans are repriced or hedges are renewed, rather than on your next bill.
What happens to low user plans on 1 April 2027?
The Low Fixed Charge regulations are removed, so retailers no longer have to offer a low fixed charge option. MBIE’s phase-out schedule has the maximum permitted fixed charge reaching $1.80 a day plus GST from 1 April 2026, the last step before removal. Some retailers may keep low fixed charge plans voluntarily, but nothing will require them to.
Who decides what lines companies can charge?
The Commerce Commission. Under Part 4 of the Commerce Act, it sets default price-quality paths for non-exempt electricity distribution businesses. The current path, DPP4, runs from 1 April 2025 to 2030 and caps the revenue each lines company can recover while setting quality standards for reliability. The Commission also sets the total revenue Transpower can recover for transmission.
Why did my bill jump in 2025 and 2026 even though energy prices were flat?
Because lines charges rose sharply. The Electricity Authority reported inflation-adjusted domestic prices up 10 percent in the year to September 2025, and MBIE’s QSDEP shows the lines component rising 10.7 percent in the single quarter to 15 May 2026 while the energy and other component fell slightly. New Commerce Commission revenue allowances for network investment, applying from 1 April 2025, are the main driver.
Sources
- MBIE, Quarterly Survey of Domestic Electricity Prices to 15 May 2026 (and the 15 February 2026 edition for the quarterly comparison), mbie.govt.nz
- MBIE, Electricity cost and price monitoring (QSDEP methodology), mbie.govt.nz
- MBIE, Mid-point review of the phase-out of the Low Fixed Charge (LFC) Regulations, mbie.govt.nz
- Electricity Authority, Wholesale market (spot and hedge markets), ea.govt.nz
- Electricity Authority, Market performance quarterly review, Q3 2025, ea.govt.nz
- Electricity Authority, Open letter to distributors as low fixed charge regulations come to an end, ea.govt.nz
- Commerce Commission, 2025–2030 electricity default price-quality path (DPP4), comcom.govt.nz
- Transpower, Overview of the Transmission Pricing Methodology, transpower.co.nz
Disclaimer
This article is general information about how electricity prices in New Zealand are structured, based on official sources checked in October 2026. Prices and rules change, and the plan you are on may differ from the modelled figures quoted here. It is not financial advice. For decisions about your own supply, check your retailer’s current pricing and the official sources listed above.
More guides like this one are in our Business & Industry hub.